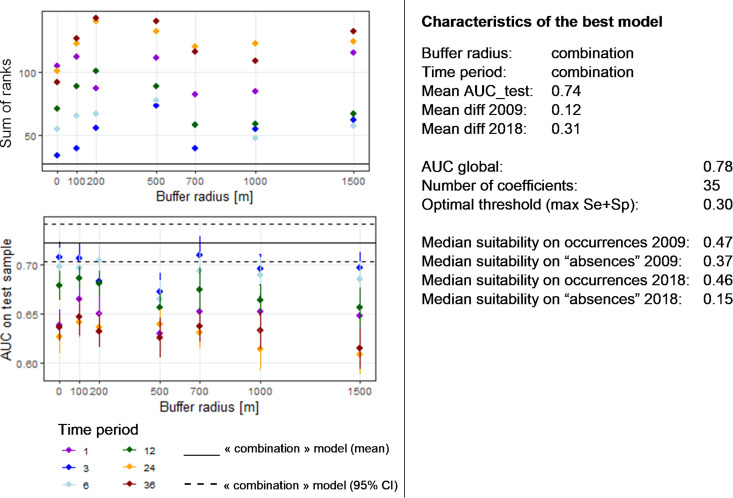
FIG 4.
Performance of models predicting the suitability for Chlamydiales. (Left) Values of the AUCtest and the sum of ranks as a function of the buffer radius and the time period (in months) considered for the extraction of the environmental variables. For the AUCtest, the points indicate the mean value computed over the 20 runs and the lines correspond to the 95% confidence intervals. The “combination” model refers to the model derived by using for each environmental variable the combination of time period and buffer radius that best discriminates the tick’s presence from background locations (t test). (Right) Characteristics of the best model chosen according to the graphs at the left. Mean diff 2009 and mean diff 2018 are the average differences between the mean suitability values predicted on Chlamydiales occurrence points and on “absences,” i.e., locations where no Chlamydiales were identified in 2009 and 2018, respectively.

