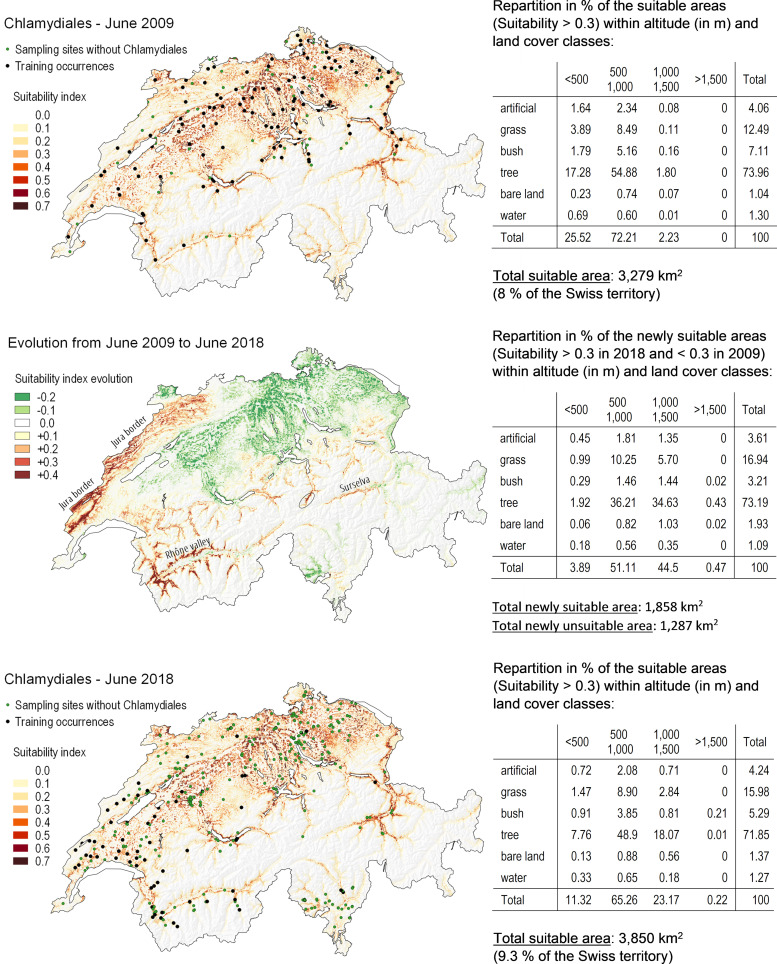
FIG 6.
Suitability maps for Chlamydiales in June 2009 (upper panel) and June 2018 (lower panel) as predicted by the best model (i.e., with the “combination” set of environmental variables). The areas affected by transitions in suitability are represented in the middle panel. The green dots show sites where ticks were sampled but no Chlamydiales were identified. Note that, as explained in the text, these sites cannot be considered real “absences.”

