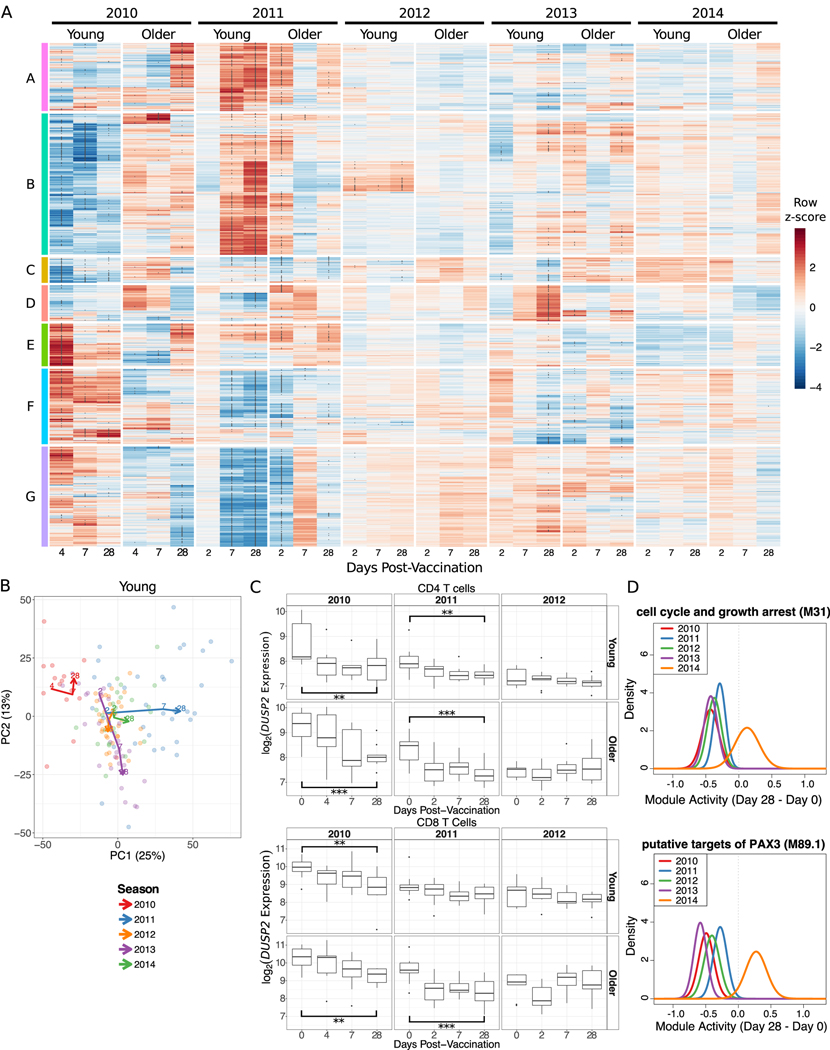
Figure 2. Substantial Seasonal Variability in Signatures Induced by Influenza Vaccination.
(A) A row-normalized heatmap of the 2,462 significantly differentially expressed genes (DEGs). Clusters A-G were defined by hierarchical clustering. Asterisks within the heatmap indicate genes significantly differentially expressed compared to day 0. (B) The first two principal components from a principal component analysis of all DEGs. Each point is a sample and lines connect the median of the points at each day post-vaccination within each season. (E) DUSP2 expression in sorted CD4 and CD8 T cells. ** p < 0.01, *** p < 0.001 one-sided t-test comparing day 28 and day 0 only. (F) Probability density functions calculated by QuSAGE for two representative gene modules significantly downregulated 28 days post-vaccination in four seasons. M31 contains DUSP1 while M89.1 contains both DUSP1 and DUSP2.

