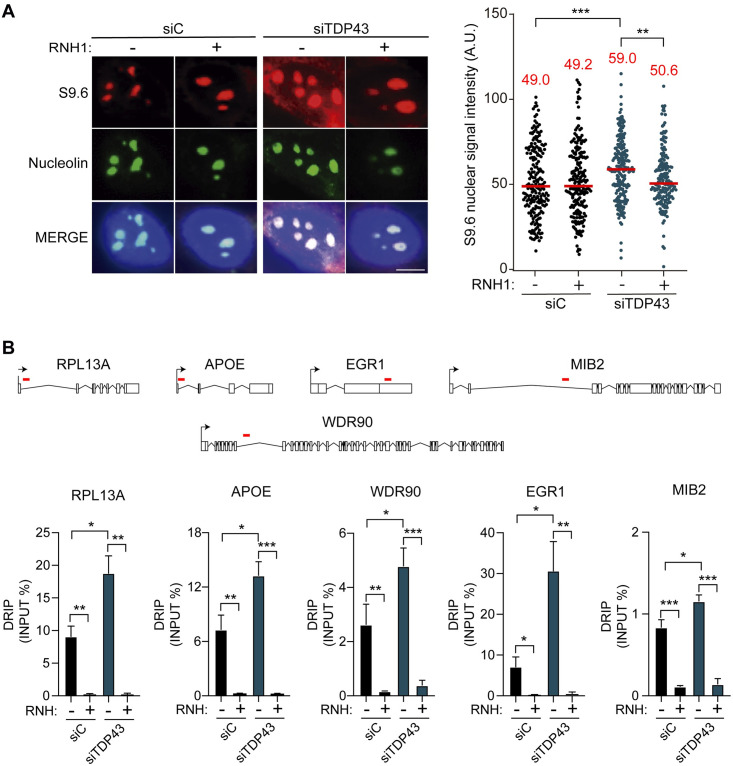
Fig 1. R-loops accumulation in siTDP-43 HeLa.
A) siC and siTDP-43 HeLa immunostaining with antiS9.6 antibody and anti-nucleolin antibody. The graph shows the median of the S9.6 intensity per nucleus after nucleolar signal removal. Around 300 cells from three independent experiments were considered. Scale bar: 25μm. ***, P < 0,0002; **, P < 0,001 (Mann-Whitney U test, two-tailed). B) DRIP-qPCR using the anti S9.6 antibody at RPL13A, APOE, WDR90, EGR1 and MIB2 are shown in siC HeLa and siTDP-43 HeLa. Pre-immunoprecipitated samples were untreated (-) or treated (+) with RNaseH, as indicated. Data represent mean ± SEM from three independent experiments. *, P <0,05, **, P < 0,01, ***, P < 0,001 (Upaired t test, one-tailed). In all cases, when no asterisk is shown indicates that is not significant.

