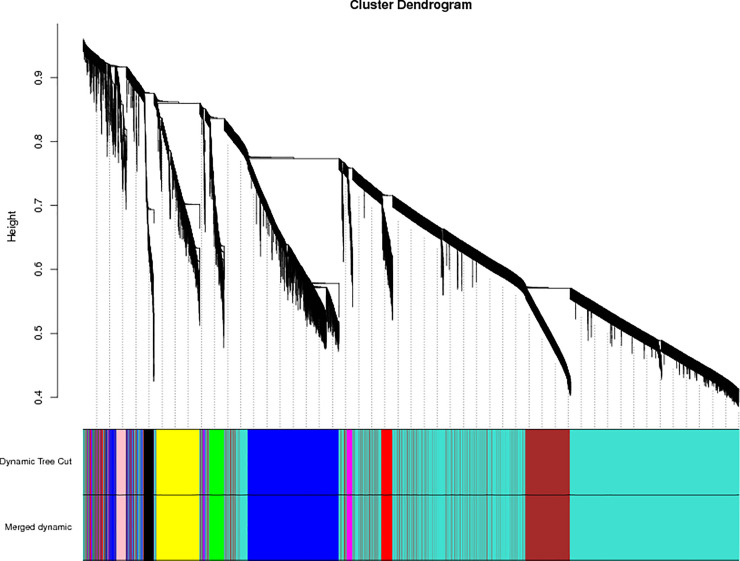
Fig 3. Module hierarchical clustering tree.
Dynamic tree cut indicates module divided according to clustering results; merged dynamic indicates module divided according to similarity of the module. Analysis was carried out according to the merged module. Vertical distance in tree diagrams represents distance between two nodes (between genes); horizontal distance is meaningless.

