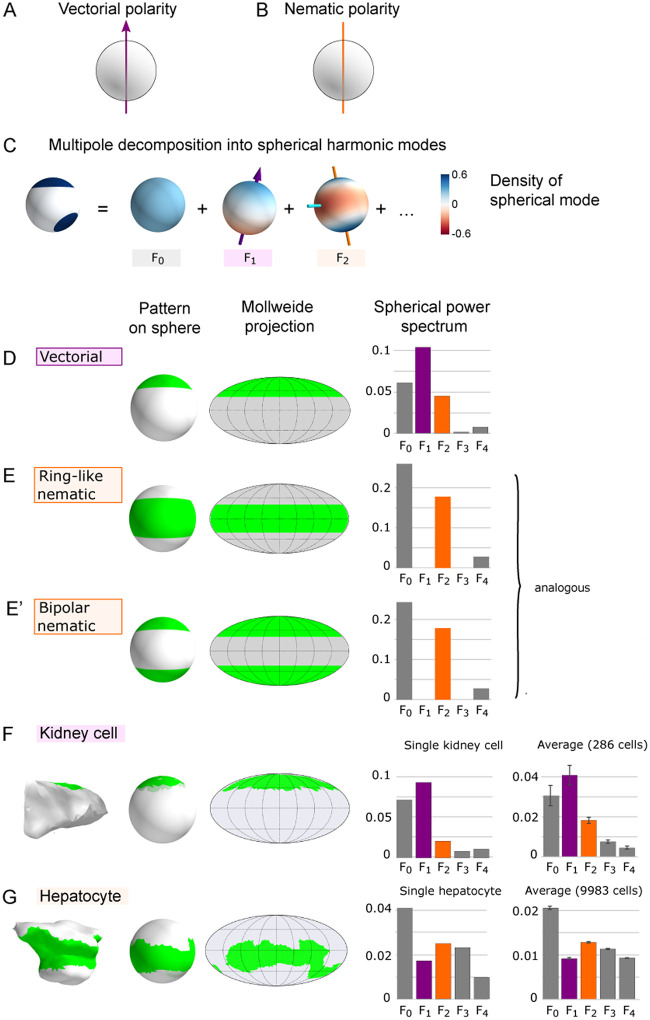
Fig 1. Multipole decomposition of surface patterns.
(A, B) Schematic of vectorial and nematic cell polarity, respectively. (C) Multipole decomposition of a distribution on a sphere into spherical harmonics, see Eq (1). (D) Prototypical membrane distribution of vectorial polarity type with respective Mollweide projection and spherical power spectrum. The spherical power spectrum shows the power ||Fi||2 of the each mode Fi corresponding to the contribution from spherical harmonics of order i, i = 0, 1, 2, 3, 4, see Eq (2). (E) Same as panel D but for a ring-like surface distribution. Here, the second mode of the spherical power spectrum dominates. (E’) The second mode of the spherical power spectrum also dominates for the analogous case of a bipolar surface distribution. (F) Spherical projection, Mollweide projection and spherical power spectrum for an epithelial tubular cell from kidney tissue, as well as averaged power spectrum for a population of cells (n = 286, mean±2 ⋅ s.e.m., corresponding to 95% confidence interval). (G) Same as panel F, but for a hepatocyte from mouse liver tissue, as well as a population of hepatocytes (n = 9983).

