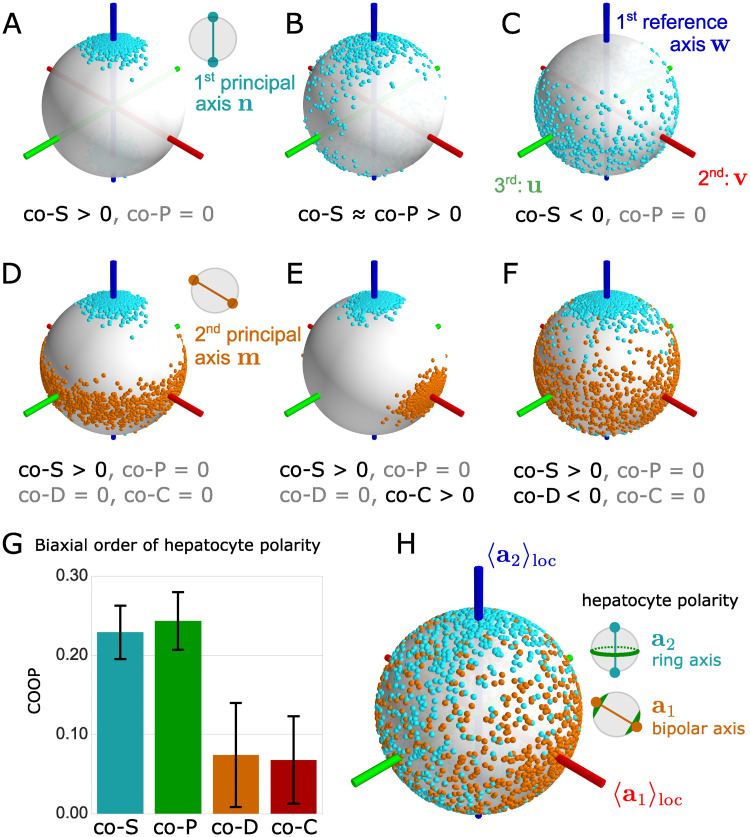
Fig 3. Four biaxial co-orientational order parameters applied to liver tissue.
(A) Ensemble of first principal axes n, represented as pairs of antipodal points (cyan) on the unit sphere; the ensemble displays prolate nematic order with respect to the first reference axis w (blue). This type of order is characterized by a positive value of the co-orientational order parameter co−S, co−S > 0. First reference axis w (blue line), second reference axis v (red), third reference axis u (green). (B) Example of a phase biaxial distribution of first principal axes n (cyan dots) with nematic alignment towards the first reference axis w (blue) and strong anisotropic fluctuations biased towards the third reference axis u (green), corresponding to a positive value of the phase-biaxiality order parameter co−P, co−P > 0. (C) Example of oblate nematic order of n with respect to the first reference axis w, corresponding to co−S < 0. (D) Ensemble of tripods of principal axes n, m, l that displays prolate nematic order of the first principal axis n (cyan dots) with respect to the first reference axis w (blue), but no additional order of the second principal axis m (golden dots); third principal axis not shown. Since there is no additional order of m, we have co−D = co−C = 0. (E) Example of molecular biaxial order quantified by the co-orientational order parameter co−C. Here, the first principal axis n (cyan dots) displays prolate nematic order as in panel D, while the second principal axis m (golden dots) is additionally biased towards the second reference axis v (red), corresponding to co−C > 0. (F) A second type of molecular biaxial order is measured by the co-orientational order parameter co−D. Here, the first principal axis n (cyan dots) exhibits nematic order with respect to the first reference axis w (blue). Fluctuations of the second principal axis m (golden dots) are also biased towards w, corresponding to co−D < 0. (G) Co-orientational order parameters quantify biaxial order of hepatocytes in liver tissue (mean±s.d., n = 12 tissue samples). The local reference system was chosen as a local average with punctured Gaussian kernel, see text for details. (H) Spherical distribution of apical ring axis a2 (antipodal pairs of cyan dots) and apical bipolar axis a1 (golden dots) of hepatocyte cell polarity relative to the reference axes w = 〈a2〉loc (blue), v = 〈a1〉loc (red), u = v × w (green), illustrating the quantitative analysis in panel G.

