
Figure 4.
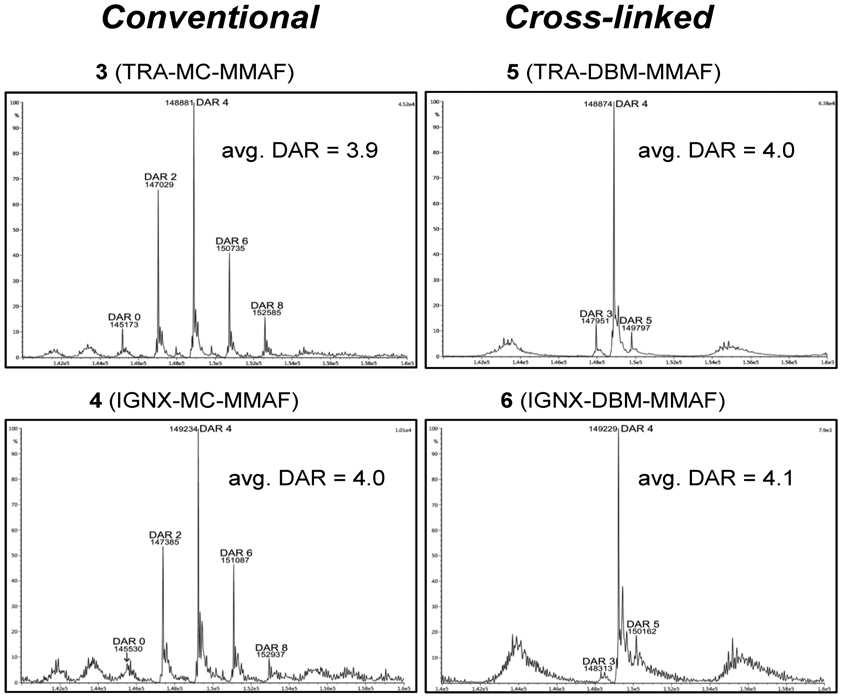
Native LC/MS analysis comparing DAR compositions of conventional ADCs, 3 and 4, with cross-linked DBM ADCs, 5 and 6. The data shown are the deconvoluted MS profiles, and observed MWs are consistent with calculated MWs within ±2 AMUs. Average DAR values shown for each ADC were calculated based on peak intensities.