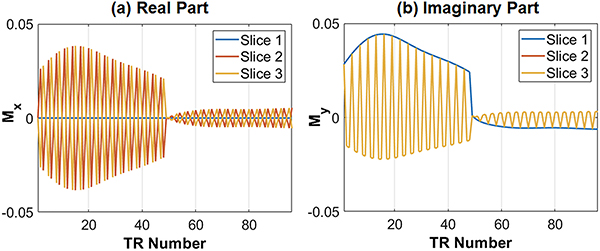
Figure 1.
Examples of SMS cMRF signal evolutions with MB=3 for a fixed T1=1400ms and T2=50ms, which is similar to the relaxation times in myocardial tissue at 3T. (a) The signal timecourse for each slice has different real parts, and (b) the imaginary part for slice 1 is different from that for slices 2 and 3 (which overlap). For clarity, only the first two heartbeats (96 TRs) of the cMRF sequence are shown.

