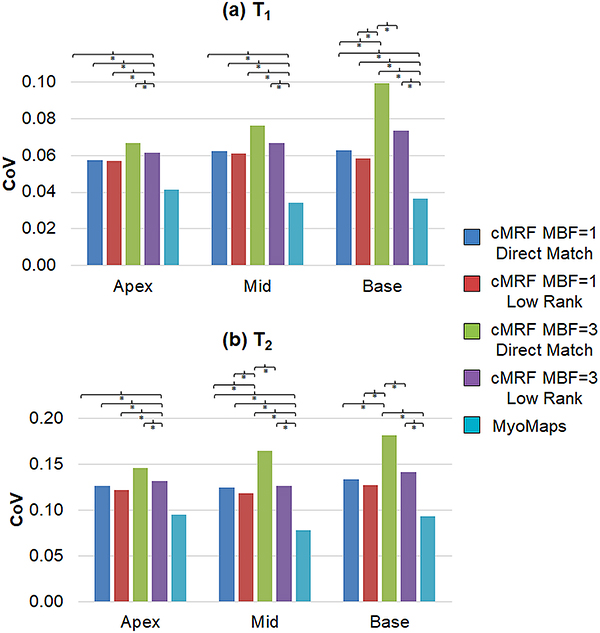
Figure 12.
Precision as measured by the coefficient of variation (CoV) within basal, medial, and apical slices. Maps were reconstructed using single-slice cMRF with direct matching (MBF=1, DM), single-slice cMRF with the low rank reconstruction (MBF=1, LR), SMS cMRF with MB=3 and direct matching (MBF=3, DM), SMS cMRF with MB=3 and the low rank reconstruction (MBF=3, LR), and conventional cardiac mapping sequences (MOLLI for T1, and T2-prepared FLASH for T2). Results are shown for (a) T1 and (b) T2. A bracket with an asterisk (*) indicates a significant difference (p < 0.05) between groups from the one-way ANOVA with Tukey’s HSD post-hoc test.

