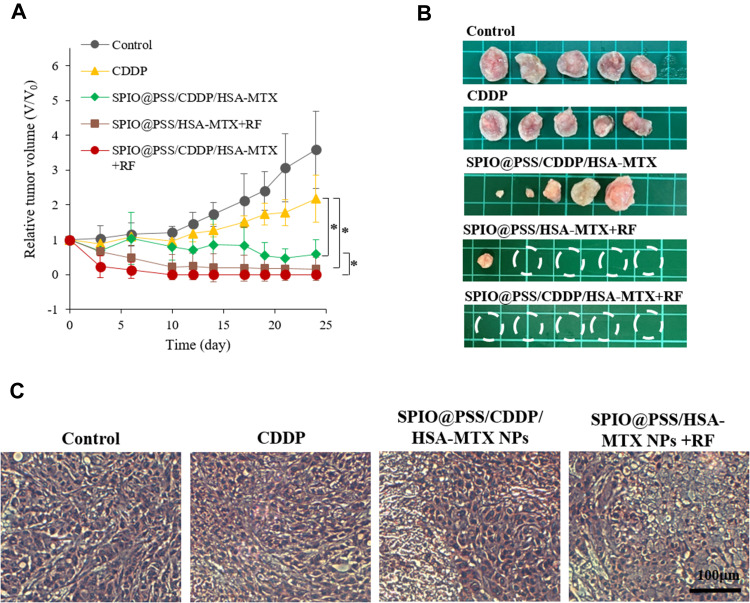
Figure 7.
(A) Relative tumor volume, (B) representative tumor images, and (C) H&E-stained images of tumor tissue treated with saline, free CDDP, SPIO@PSS/CDDP/HSA–MTX, SPIO@PSS/HSA–MTX, or SPIO@PSS/CDDP/HSA–MTX with RF generator irradiation (2.24 kW, 30 minutes) at 24 days. Scale bar=100 µm. * indicates p < 0.05.

