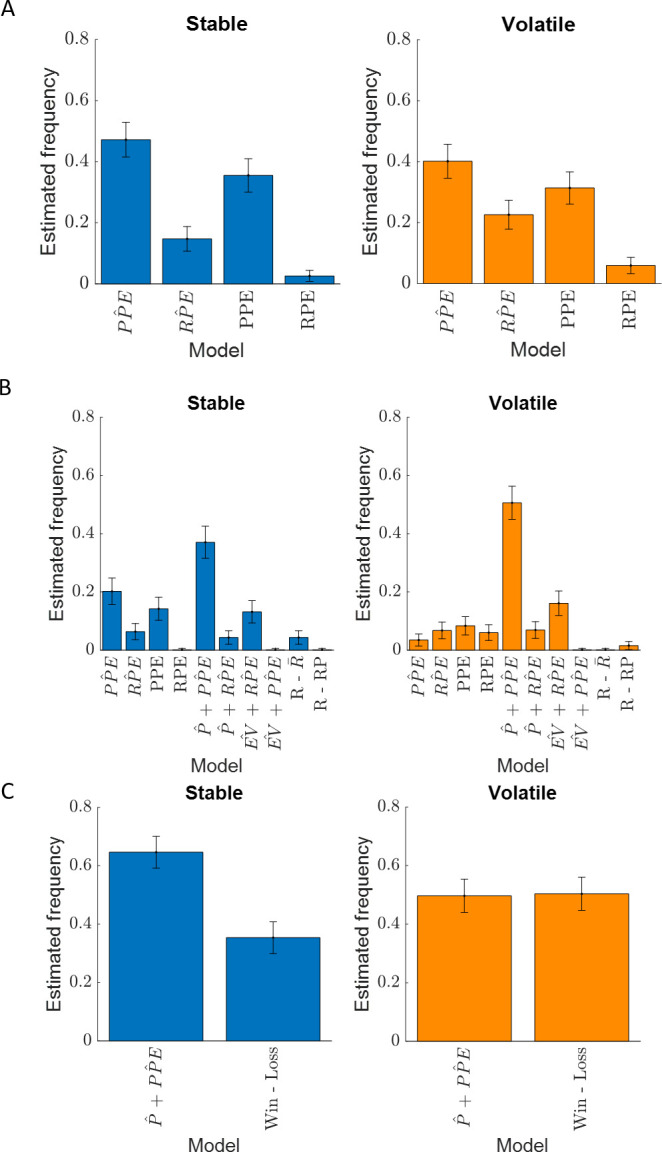
Figure 4. Happiness is more strongly associated with learning than choice.
(A) Comparison between the for the happiness model including a PPE term (denoted ) estimated in the additive choice model (y axis) and the r2 for the happiness model including an RPE term instead (denoted ). Both models had the same number of parameters. The model accounted for more variance in mood ratings on average in both stable (blue) and volatile (orange) learning tasks. Dots above the dashed line correspond to subjects for whom more variance in happiness is explained by the compared to the model. (B) The model including the chosen estimated probability (denoted and estimated from the additive choice model) better explained happiness ratings than a model including expected value (denoted ) for both the stable (blue) and volatile (orange) environments with both models having the same number of parameters. Dots above the dashed line correspond to subjects where more variance in happiness is explained by the compared to the model. See Figure 4—figure supplement 1 for the estimated model frequency or each model and Table 2 for other model comparison metrics.

Figure 4—figure supplement 1. Estimated model frequency.