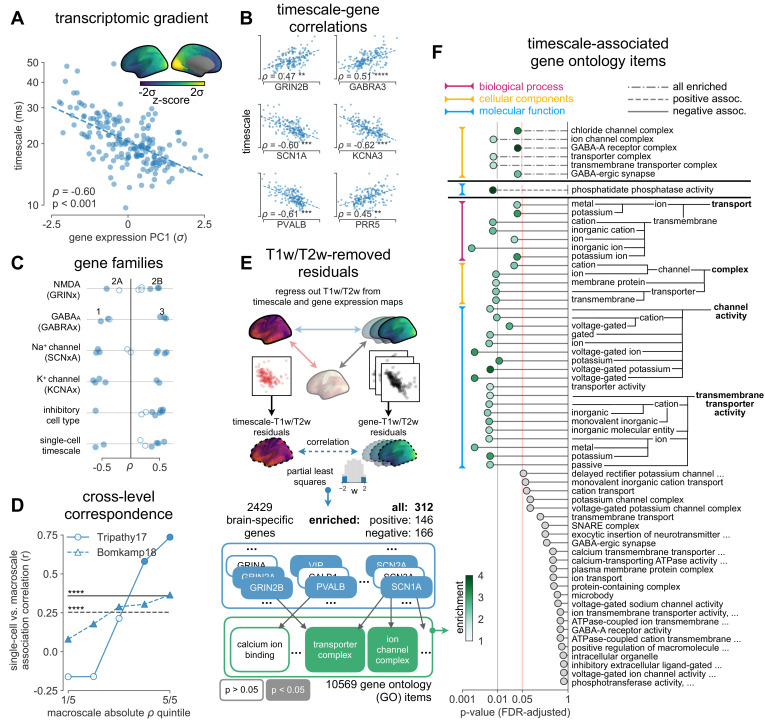
Figure 3. Timescale gradient is linked to expression of genes related to synaptic receptors and transmembrane ion channels across the human cortex.
(A) Timescale gradient follows the dominant axis of gene expression variation across the cortex (z-scored PC1 of 2429 brain-specific genes, arbitrary direction). (B) Timescale gradient is significantly correlated with expression of genes known to alter synaptic and neuronal membrane time constants, as well as inhibitory cell-type markers, but (C) members within a gene family (e.g., NMDA receptor subunits) can be both positively and negatively associated with timescales, consistent with predictions from in vitro studies. (D) Macroscale timescale-transcriptomic correlation captures association between RNA-sequenced expression of the same genes and single-cell timescale properties fit to patch clamp data from two studies, and the correspondence improves for genes (separated by quintiles) that are more strongly correlated with timescale (solid: N = 170 [Tripathy et al., 2017], dashed: N = 4168 genes [Bomkamp et al., 2019]; horizontal lines: correlation across all genes from the two studies, ρ = 0.36 and 0.25, p<0.001 for both). (E) T1w/T2w gradient is regressed out from timescale and gene expression gradients, and a partial least squares (PLS) model is fit to the residual maps. Genes with significant PLS weights (filled blue boxes) compared to spatial autocorrelation (SA)-preserved null distributions are submitted for gene ontology enrichment analysis (GOEA), returning a set of significant GO terms that represent functional gene clusters (filled green boxes). (F) Enriched genes are primarily linked to potassium and chloride transmembrane transporters, and GABA-ergic synapses; genes specifically with strong negative associations further over-represent transmembrane ion exchange mechanisms, especially voltage-gated potassium and cation transporters. Branches indicate GO items that share higher-level (parent) items, e.g., voltage-gated cation channel activity is a child of cation channel activity in the molecular functions (MF) ontology, and both are significantly associated with timescale. Color of lines indicate curated ontology (BP—biological process, CC—cellular components, or MF). Dotted, dashed, and solid lines correspond to analysis performed using all genes or only those with positive or negative PLS weights. Spatial correlation p-values in (A–C) are corrected for SA (see Materials and methods; asterisks in (B,D) indicate p<0.05, 0.01, 0.005, and 0.001 respectively; filled markers in (C,D) indicate p<0.05).


