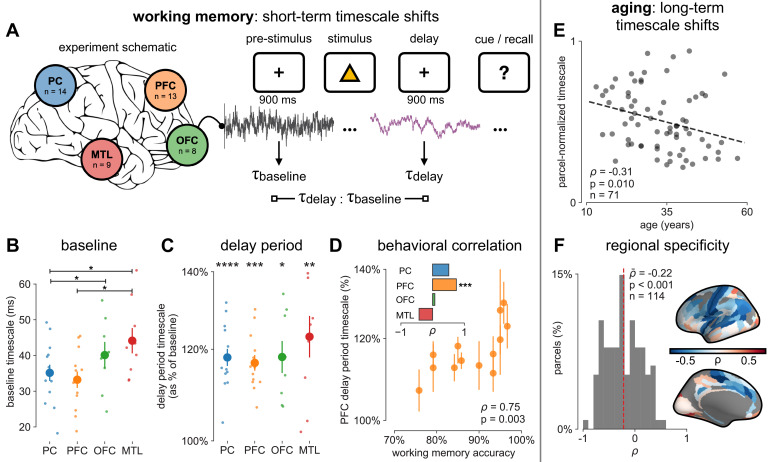
Figure 4. Timescales expand during working memory maintenance while tracking performance, and task-free average timescales compress in older adults.
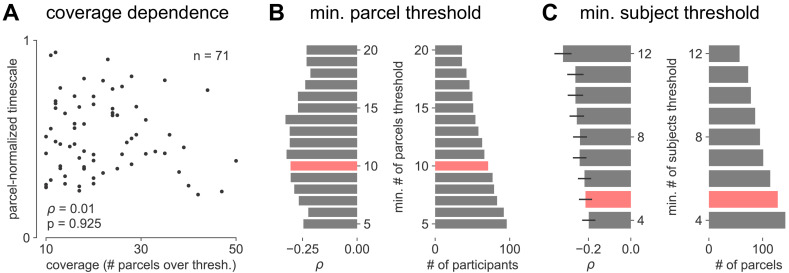
(A) Fourteen participants with overlapping intracranial coverage performed a visuospatial working memory task, with 900 ms of baseline (pre-stimulus) and delay period data analyzed (PC: parietal, PFC: prefrontal, OFC: orbitofrontal, MTL: medial temporal lobe; n denotes number of subjects with electrodes in that region). (B) Baseline timescales follow hierarchical organization within association regions (*: p<0.05, Mann–Whitney U-test; small dots represent individual participants, large dots and error bar for mean ± s.e.m. across participants). (C) All regions show significant timescale increase during delay period compared to baseline (asterisks represent p<0.05, 0.01, 0.005, 0.001, Wilcoxon signed-rank test). (D) PFC timescale expansion during delay periods predicts average working memory accuracy across participants (dot represents individual participants, mean ± s.e.m. across PFC electrodes within participant); inset: correlation between working memory accuracy and timescale change for all regions. (E) In the MNI-iEEG dataset, participant-average cortical timescales decrease (become faster) with age (n = 71 participants with at least 10 valid parcels, see Figure 4—figure supplement 2B). (F) Most cortical parcels show a negative relationship between timescales and age, with the exception being parts of the visual cortex and the temporal poles (one-sample t-test, t = −7.04, p<0.001; n = 114 parcels where at least six participants have data, see Figure 4—figure supplement 2C).


