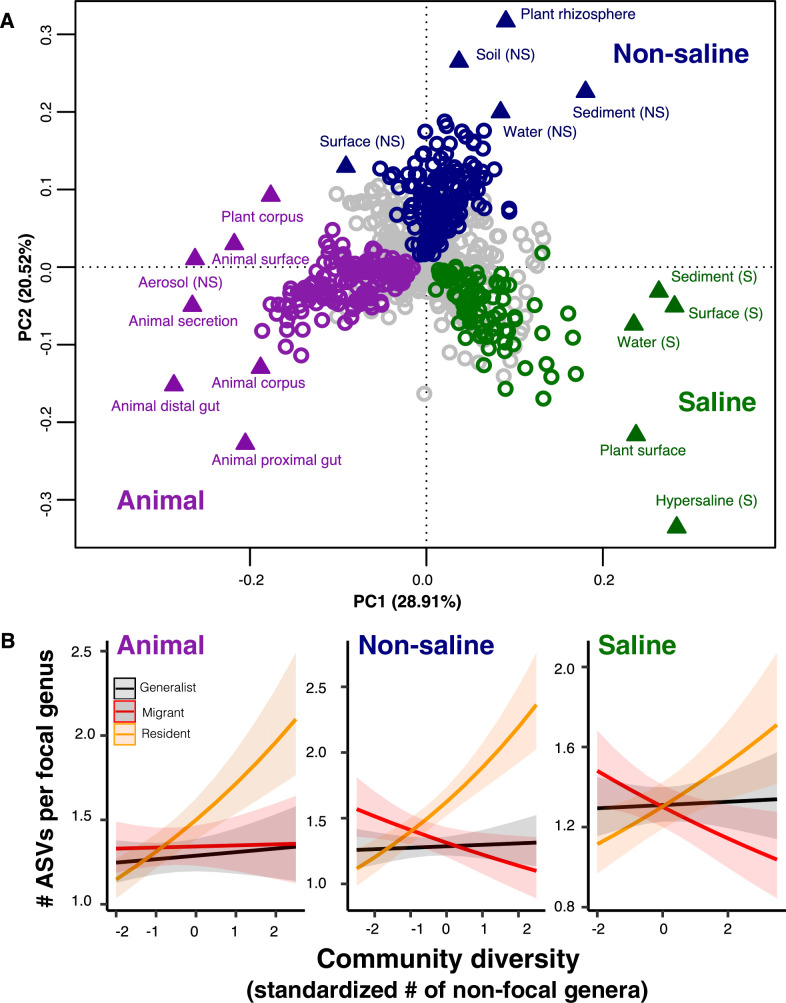
Figure 4. The DBD relationship varies between resident and non-resident genera.
(A) Ordination showing genera clustering into their preferred environment clusters. The matrix of 17 environments (rows) by 1128 genera (columns) by, with the matrix entries indicating the percentage of samples from a given environment in which each genus is present, was subjected to principal components analysis (PCA). Circles indicate genera and triangles indicate environments (EMPO 3 biomes). coloured circles are genera inferred by indicator species analysis to be residents of a certain environmental cluster, and grey circles are generalist genera. The three environment clusters identified by fuzzy k-means clustering are: Non-saline (NS, blue), saline (S, green) and animal-associated (purple). Triangles of the same colour indicate EMPO 3 biomes clustered into the same environmental cluster. (B) DBD in resident versus non-resident genera across environment clusters. Results of GLMMs modelling focal lineage diversity as a function of the interaction between community diversity and resident/migrant/generalist status. The x-axis shows the standardized number of non-focal resident genera (community diversity); the y-axis shows the number of ASVs per focal genus. Resident focal genera are shown in orange, migrant focal genera in red, and generalist focal genera in black. Red stars indicate a significantly positive or negative slope (Wald test, p<0.005). See Supplementary file 2 for model goodness of fit.


