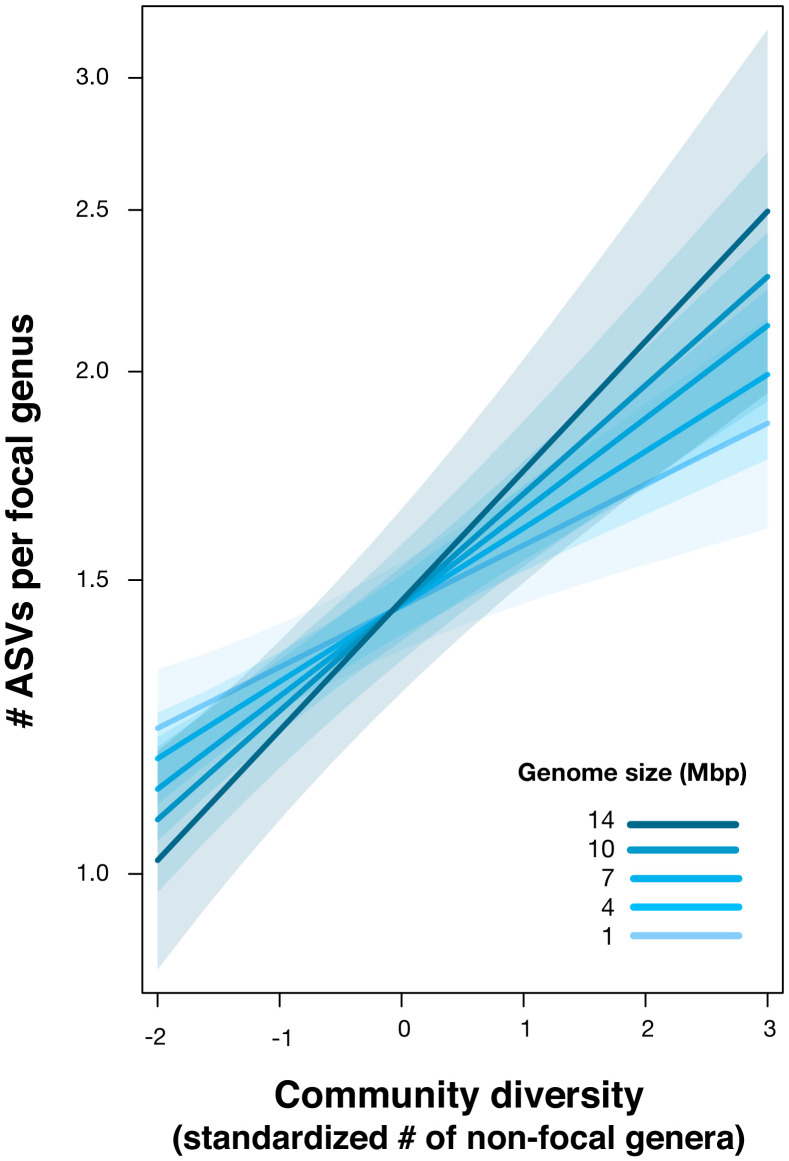
Figure 5. Positive effect of genome size on DBD.
Results are shown from a GLMM predicting focal lineage diversity as a function of the interaction between community diversity and genome size at the ASV:Genus ratio (Supplementary file 1 Section 6). The x-axis shows the standardized number of non-focal genera (community diversity); the y-axis shows the number of ASVs per focal genus. Variable diversity slopes corresponding to different genome sizes are shown in a blue colour gradient; the shaded area depicts 95% confidence limits of the fitted values. See Supplementary file 2 for model goodness of fit.

