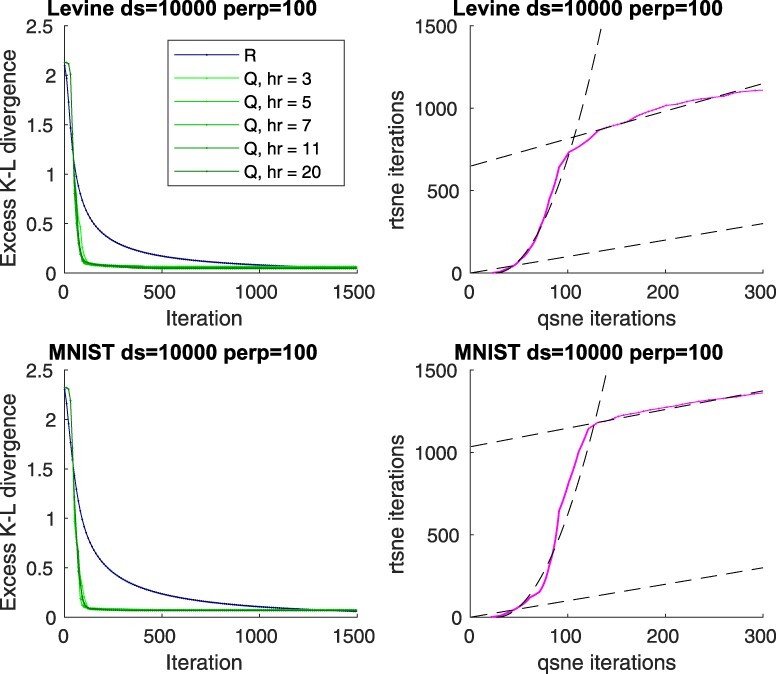
Fig. 1.

Convergence of qSNE versus a linear t-SNE implementation. Left panels: Progress, as quantified by the excess objective value above the optimum (determined experimentally) as a function of number of iterations for the Levine (Levine et al., 2015) and MNIST (Lecun et al., 1998) datasets, randomly downsampled to 10 000 samples at perplexity 100, for both our quadratic implementation (Q) with various ranks of Hessian matrix approximation (hr) and for a linear Rtsne implementation (R). Right panels: Number of consumed iterations for equal progress (objective value) for the two methods (magenta curve). The dashed black lines indicate a linear or a quadratic fit. (Color version of this figure is available at Bioinformatics online.)
