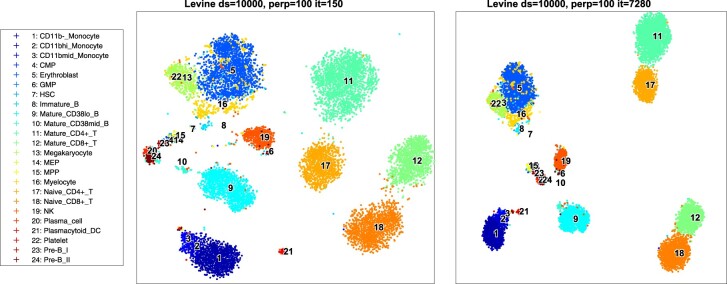
Fig. 2.
Levine bone marrow data mapped into 2-D. Left panel: qSNE with rank-11 Hessian matrix approximation after only 150 quasi-Newton iterations; and right panel: t-SNE after 7280 iterations (cf. Fig. 1). The datasets were randomly downsampled to 10 000 samples and perplexity is set to 100 in both cases

