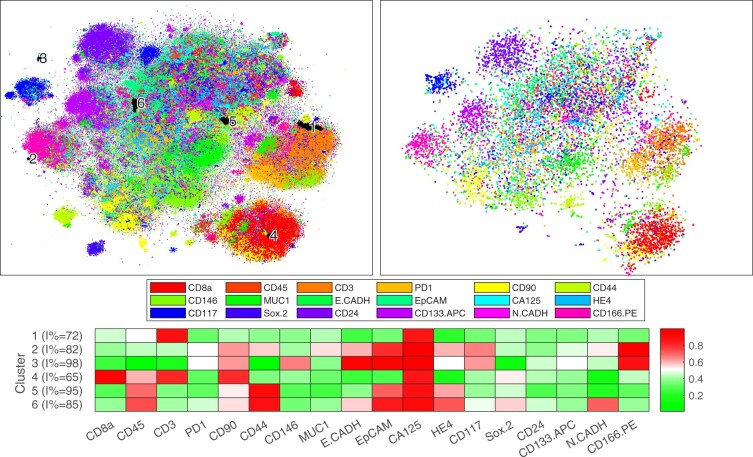
Fig. 5.
t-SNE mappings for a combined sample before and after chemotherapy for an ovarian cancer patient. Left panel: qSNE (173 374 cells, perplexity 150, Hessian matrix rank 5); and right panel: Rtsne (10 000 cells, perplexity 50). The hue indicates the most prominent marker, as indicated in the legend, and the saturation its level. Black highlighting indicates clusters of interest that are not identifiable in the downsampled analysis (unhighlighted data in Supplementary Fig. S4). The bottom panel shows a heatmap of the average expression of the highlighted clusters. (Color version of this figure is available at Bioinformatics online.)

