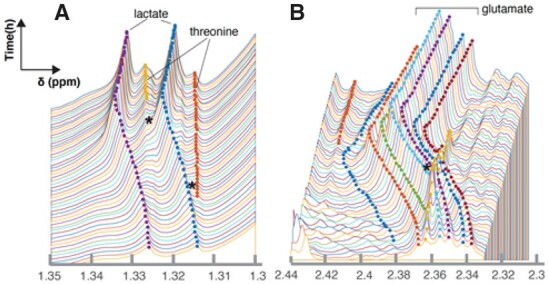
Fig. 5.

Evaluation of RTExtract on complex overlapping regions on the experimental datasets. Two ROIs (A–B) were selected as examples. Peaks in these ROIs can be precisely tracked, and the parts that are problematic in the previous method are indicated with stars. The middle six peaks in B are annotated to glutamate. Different point colors indicate different tracked peaks. Performance of the algorithm for less complex regions is in Figure 4 and Supplementary Figure S7. More example results from RTExtract and comparison with the previous method are in Supplementary Figure S8. Tracking for B is given as an example in Supplementary File S1
