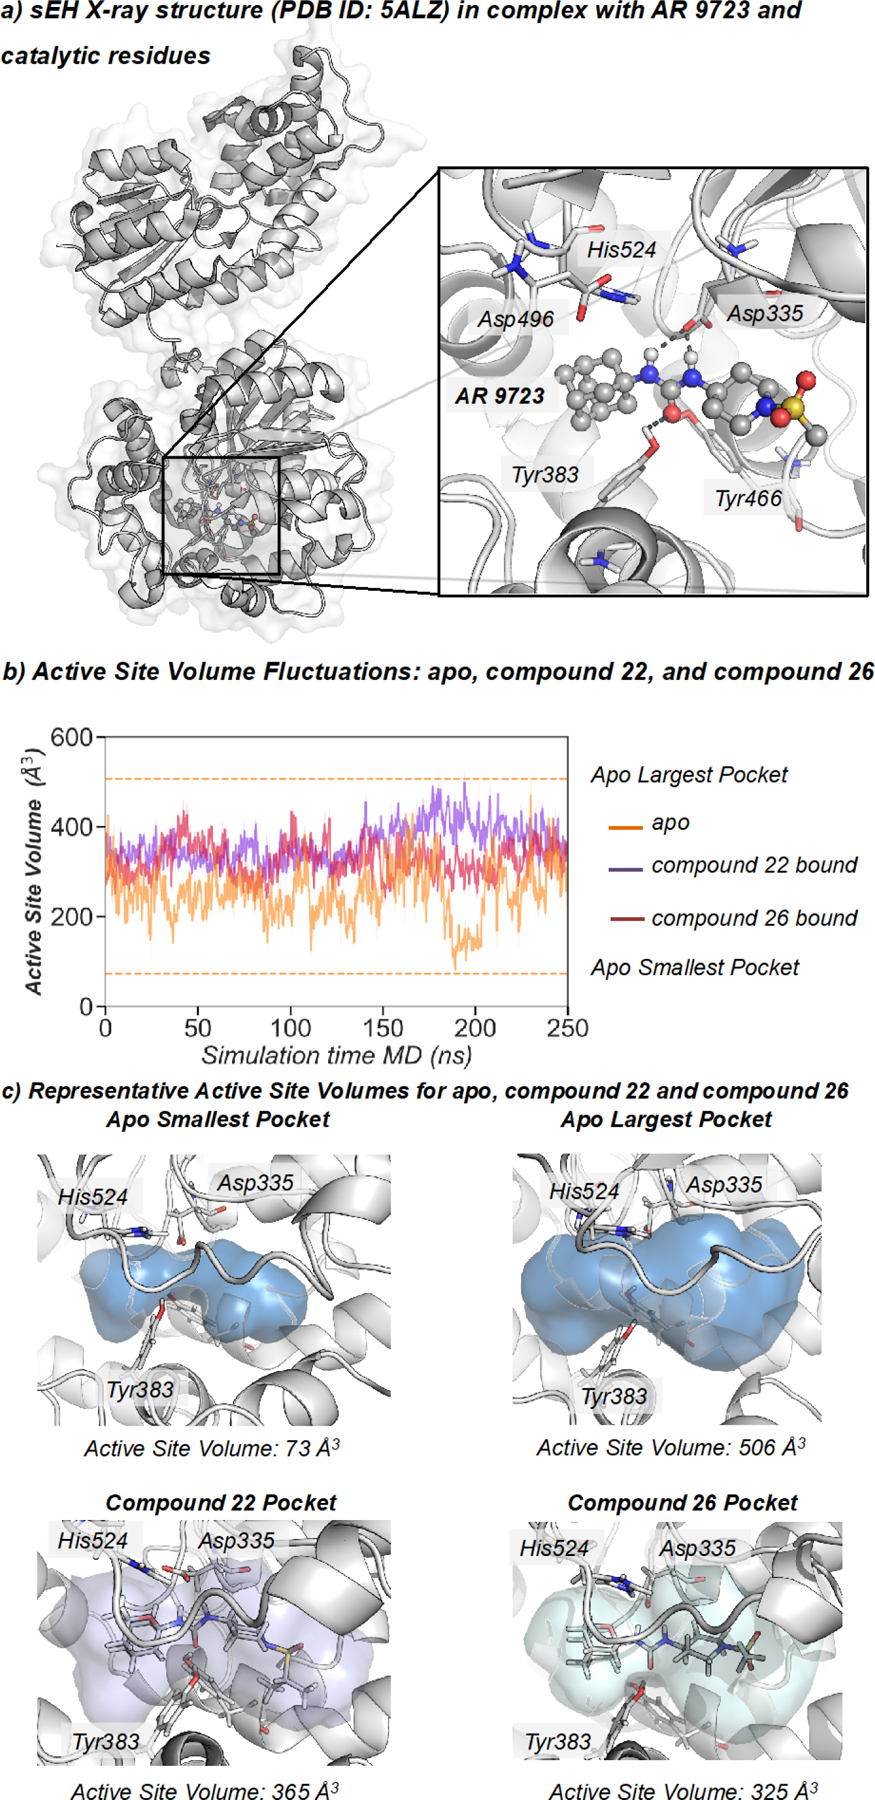
Figure 2.

a) Representation of sEH structure (PDB: 5ALZ), active site catalytic residues (nucleophilic Asp335, Tyr383, Tyr466, and the histidine-aspartic acid pair His524-Asp496. b) Plot of the fluctuations of the active site volume for the apo state (orange line, 253 ± 62 Å3), compound 22 bound (purple line, 361 ± 43 Å3), and compound 26 bound (red line, 324 ± 41 Å3) along a representative 250 ns MD simulation trajectory. c) Representative sEH structures with the active site volume obtained from MD simulations of apo, 22, and 26.
