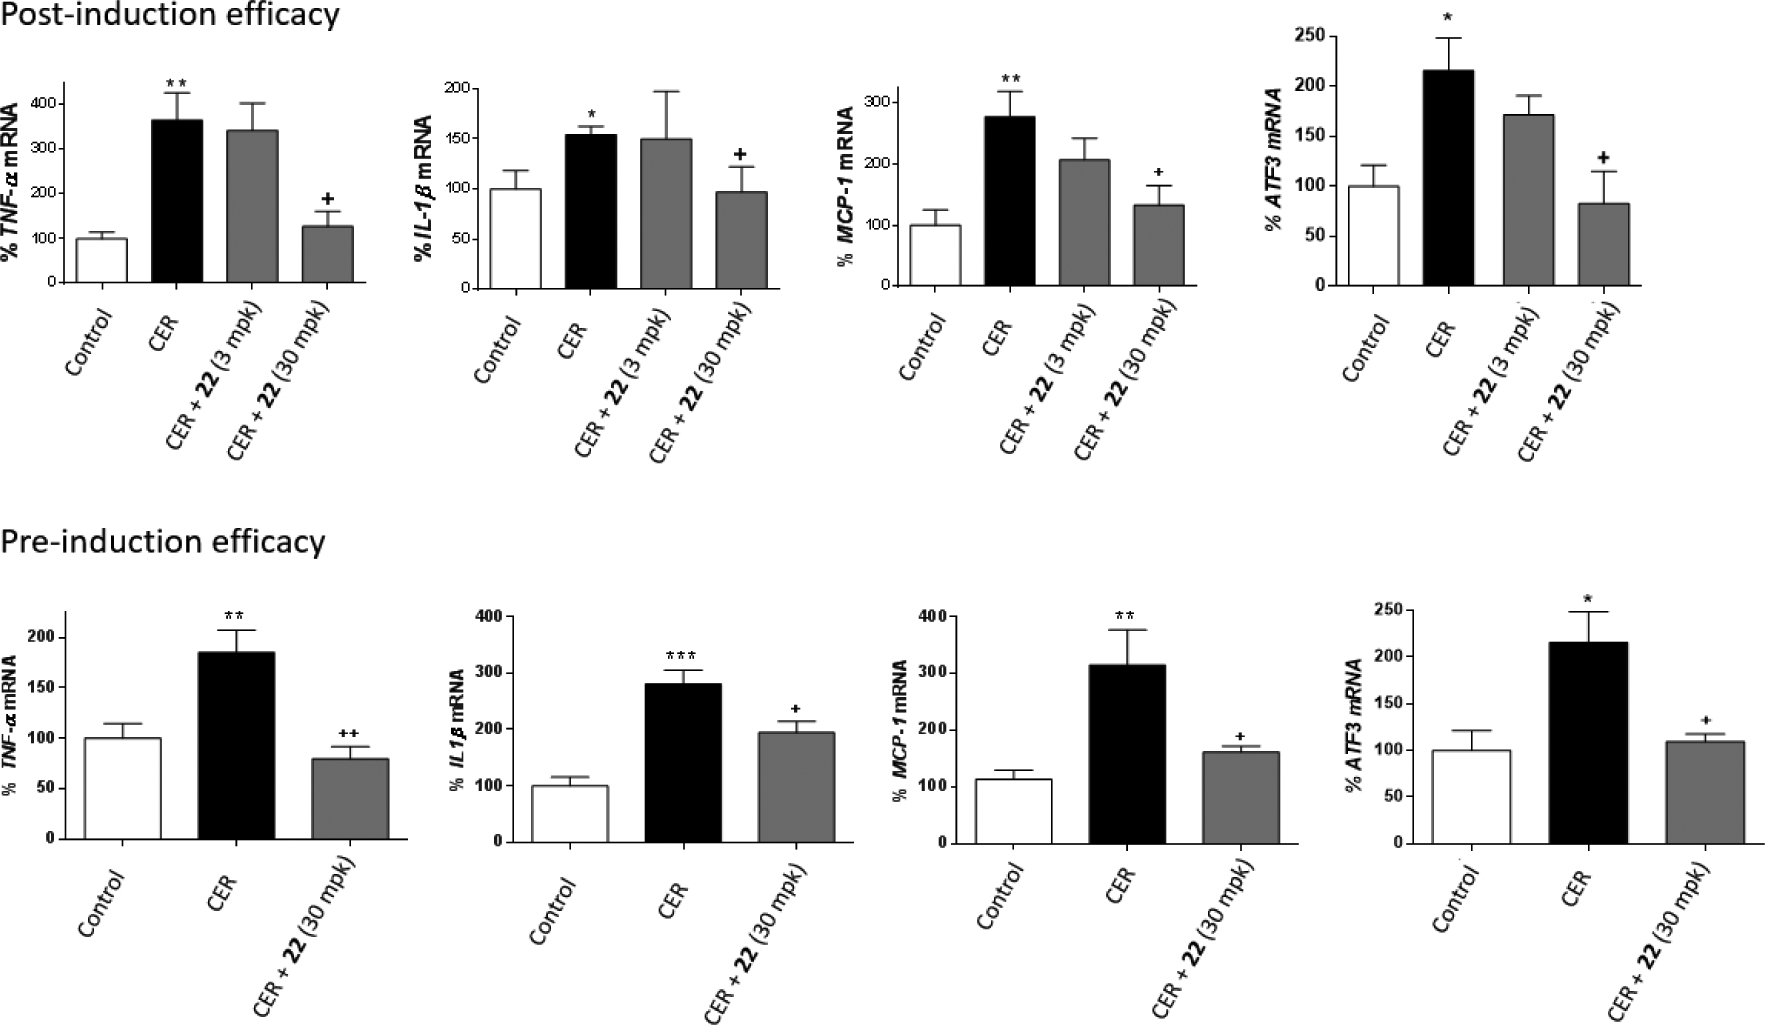
Figure 5:

Results of the in vivo studies of cerulein-induced AP in the post- and pre-induction models. TNFa, IL-1β, MCP-1 and ATF3 mRNA levels are presented as the mean ± SEM (n = 5 per group). *p<0.05, **p<0.01, ***p<0.001 vs. control. +p<0.05, ++p<0.01 vs. cerulein (CER).
