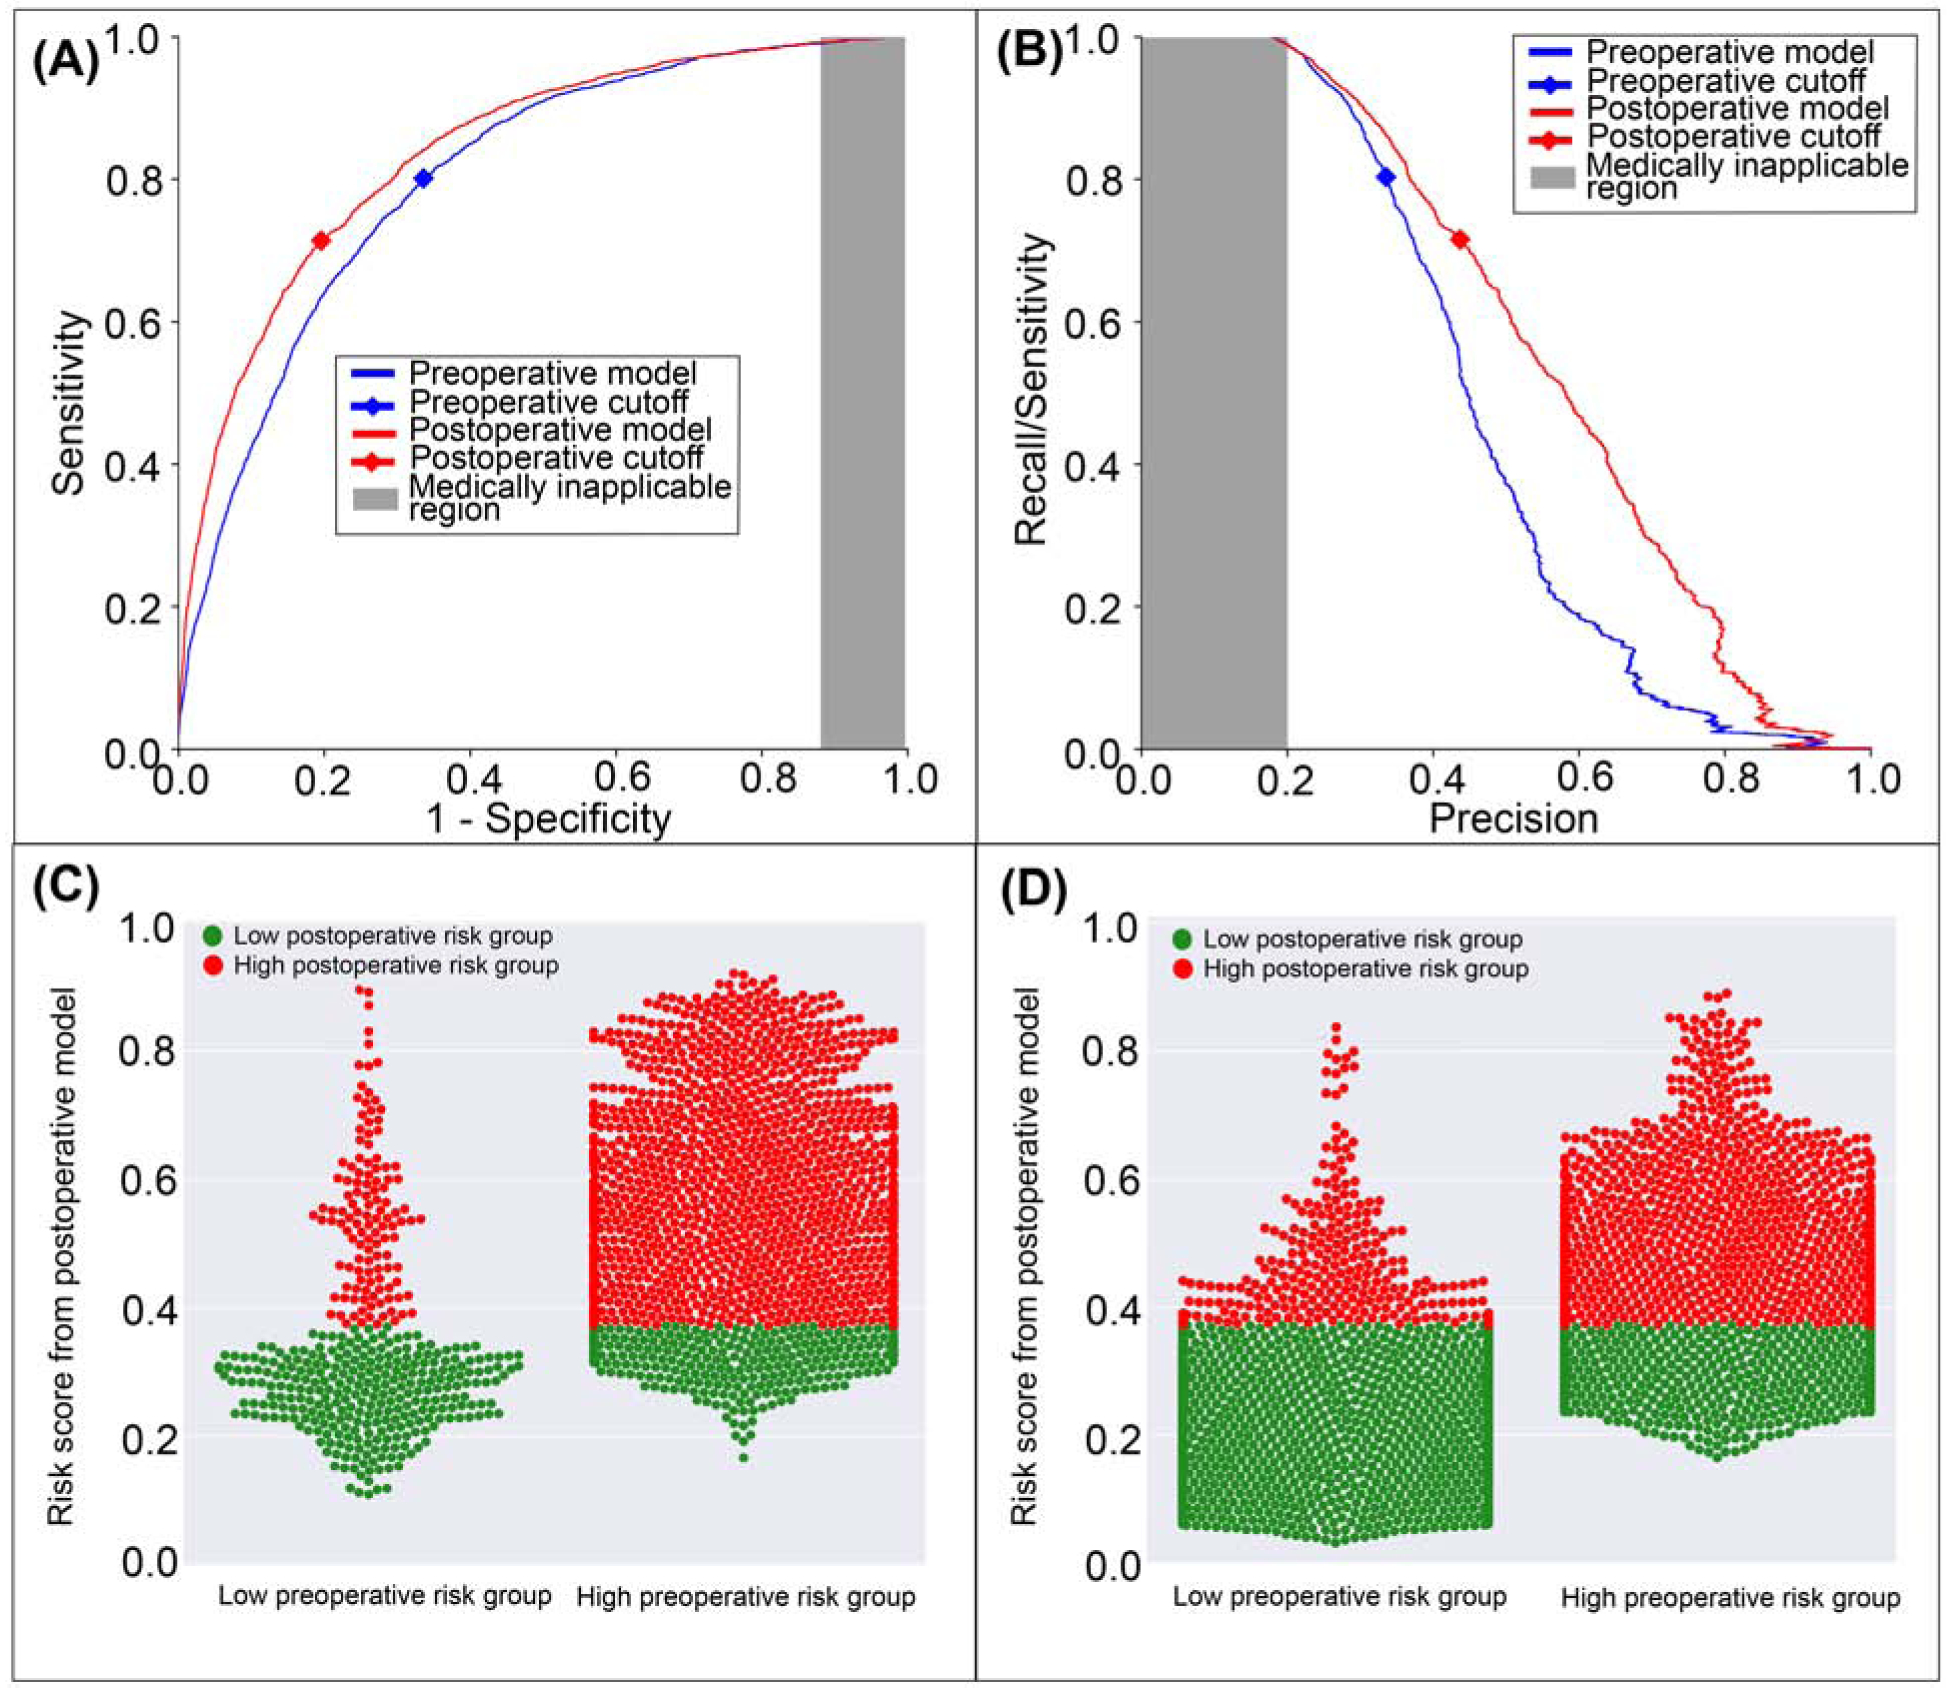
Figure 6: A model using both preoperative and intraoperative data outperformed a model using preoperative data alone in predicting postoperative acute kidney injury.

A: The postoperative model had greater area under the receiver operating characteristic curve (0.84 vs. 0.81). B: The postoperative model had greater area under the precision-recall curve (0.57 vs. 0.47). The postoperative model reclassified cases that did (C) and did not (D) feature acute kidney injury. Red dots are patients at high-risk for mortality according to the postoperative model; green dots are patients at low-risk. C, D: The postoperative model correctly reclassified 9.9% of all cases. Gray areas represent regions for which predictive discrimination or precision are ≤0.2, precluding reasonable clinical application.
