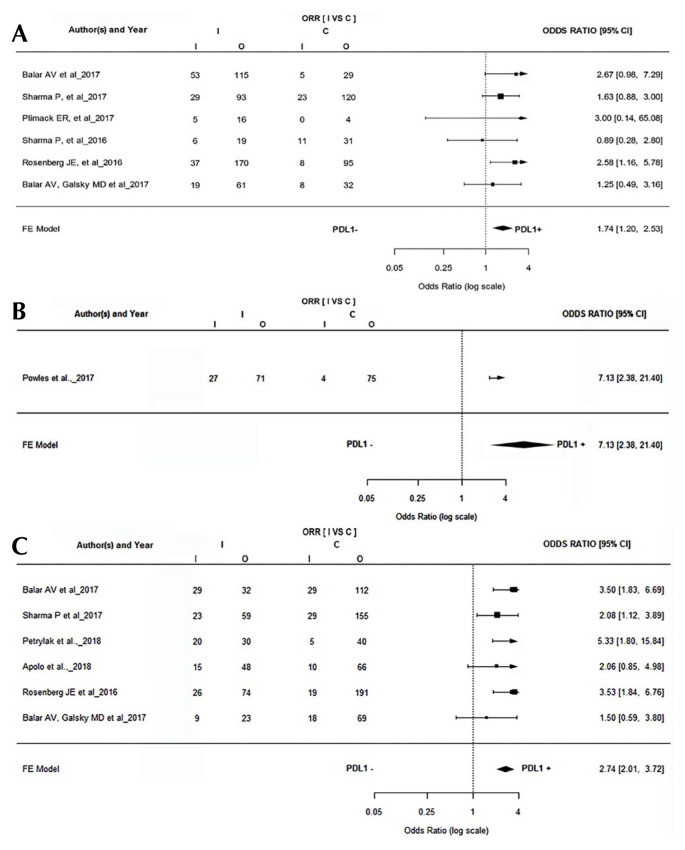
FIGURE 2.
(A) Forest plot shows that patients with higher PD-L1 positivity (PD-L1 expression threshold of ≥1%) responded better to treatment. (B) Forest plot shows that patients with higher PD-L1 positivity (PD-L1 expression threshold of ≥25%) responded better to treatment. (C) Forest plot shows that patients with higher PD-L1 positivity (PD-L1 expression threshold of ≥5%) responded better to treatment. ORR = objective response rate; I = intervention; C = control; CI = confidence interval; FE = fixed effects.

