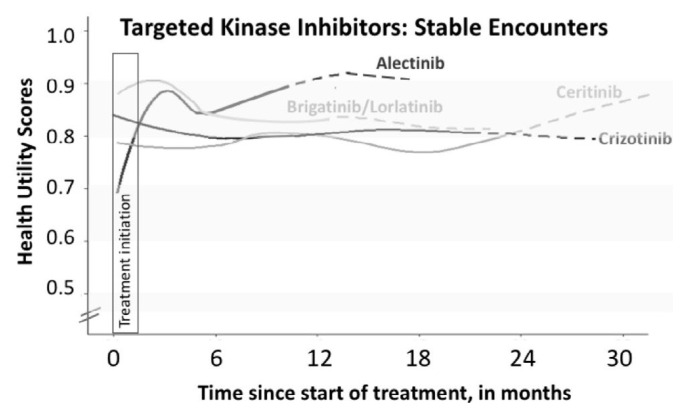
FIGURE 1.
Mean health utility scores (HUS) over time, by tyrosine kinase inhibitor treatment, for patients clinically and radiologically stable on therapy. The HUS in each treatment group were modelled using locally estimated scatterplot smoothing. When fewer patients than 25% of the original number were present, lines are dotted to reflect potential survivor bias. The first 6 weeks of treatment are marked with a box (“Treatment initiation”) to represent the typical length of time required for patients to respond to therapy.

