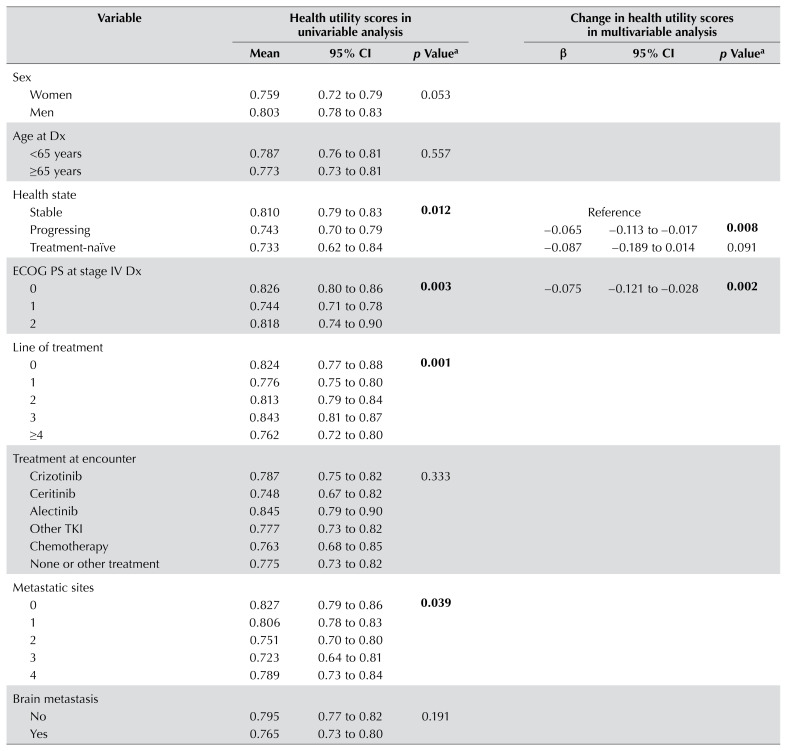
TABLE III.
Univariable and multivariable regression analyses of clinico-demographic factors affecting health utility scores, by health state
| Variable | Health utility scores in univariable analysis | Change in health utility scores in multivariable analysis | ||||
|---|---|---|---|---|---|---|
|
|
|
|||||
| Mean | 95% ci | p Valuea | β | 95% ci | p Valuea | |
| Sex | ||||||
| Women | 0.759 | 0.72 to 0.79 | 0.053 | |||
| Men | 0.803 | 0.78 to 0.83 | ||||
|
| ||||||
| Age at Dx | ||||||
| <65 years | 0.787 | 0.76 to 0.81 | 0.557 | |||
| ≥65 years | 0.773 | 0.73 to 0.81 | ||||
|
| ||||||
| Health state | ||||||
| Stable | 0.810 | 0.79 to 0.83 | 0.012 | Reference | ||
| Progressing | 0.743 | 0.70 to 0.79 | −0.065 | −0.113 to −0.017 | 0.008 | |
| Treatment-naïve | 0.733 | 0.62 to 0.84 | −0.087 | −0.189 to 0.014 | 0.091 | |
|
| ||||||
| ecog PS at stage IV Dx | ||||||
| 0 | 0.826 | 0.80 to 0.86 | 0.003 | −0.075 | −0.121 to −0.028 | 0.002 |
| 1 | 0.744 | 0.71 to 0.78 | ||||
| 2 | 0.818 | 0.74 to 0.90 | ||||
|
| ||||||
| Line of treatment | ||||||
| 0 | 0.824 | 0.77 to 0.88 | 0.001 | |||
| 1 | 0.776 | 0.75 to 0.80 | ||||
| 2 | 0.813 | 0.79 to 0.84 | ||||
| 3 | 0.843 | 0.81 to 0.87 | ||||
| ≥4 | 0.762 | 0.72 to 0.80 | ||||
|
| ||||||
| Treatment at encounter | ||||||
| Crizotinib | 0.787 | 0.75 to 0.82 | 0.333 | |||
| Ceritinib | 0.748 | 0.67 to 0.82 | ||||
| Alectinib | 0.845 | 0.79 to 0.90 | ||||
| Other tki | 0.777 | 0.73 to 0.82 | ||||
| Chemotherapy | 0.763 | 0.68 to 0.85 | ||||
| None or other treatment | 0.775 | 0.73 to 0.82 | ||||
|
| ||||||
| Metastatic sites | ||||||
| 0 | 0.827 | 0.79 to 0.86 | 0.039 | |||
| 1 | 0.806 | 0.78 to 0.83 | ||||
| 2 | 0.751 | 0.70 to 0.80 | ||||
| 3 | 0.723 | 0.64 to 0.81 | ||||
| 4 | 0.789 | 0.73 to 0.84 | ||||
|
| ||||||
| Brain metastasis | ||||||
| No | 0.795 | 0.77 to 0.82 | 0.191 | |||
| Yes | 0.765 | 0.73 to 0.80 | ||||
|
| ||||||
| Bone metastasis | ||||||
| No | 0.803 | 0.78 to 0.83 | 0.025 | |||
| Yes | 0.751 | 0.71 to 0.79 | ||||
|
| ||||||
| Liver metastasis | ||||||
| No | 0.787 | 0.77 to 0.81 | 0.206 | |||
| Yes | 0.739 | 0.64 to 0.84 | ||||
|
| ||||||
| Pleural metastasis | ||||||
| No | 0.778 | 0.75 to 0.80 | 0.461 | |||
| Yes | 0.799 | 0.76 to 0.84 | ||||
|
| ||||||
| Lymph node metastasis | ||||||
| No | 0.795 | 0.77 to 0.82 | 0.102 | |||
| Yes | 0.755 | 0.71 to 0.80 | ||||
ci = confidence interval; Dx = diagnosis; ecog PS = Eastern Cooperative Oncology Group performance status; tki = tyrosine kinase inhibitor.
Significant values shown in boldface type.

