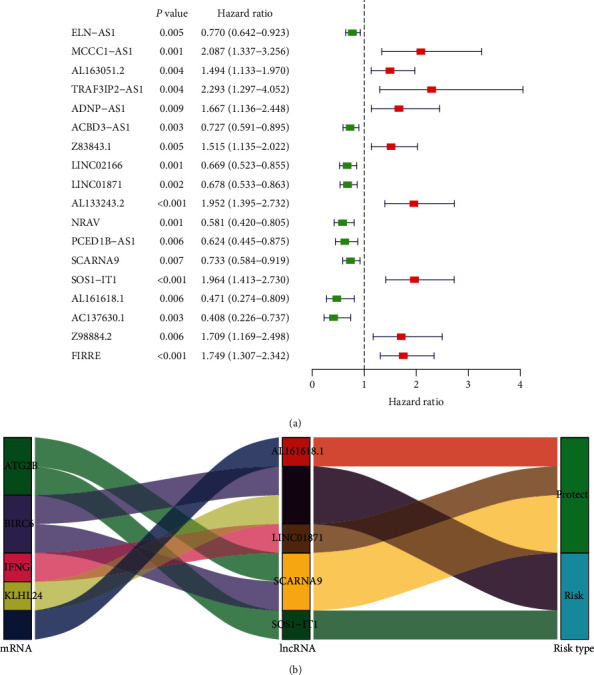
Figure 1.

Univariate Cox regression analysis. (a) Forest plot of autophagy-related lncRNAs. The P value, hazard ratio, and associated 95% confidence interval for the autophagy-related lncRNAs are shown in the plot. Red indicates a risk-associated lncRNA (HR > 1) and green indicates a protective lncRNA (HR < 1). (b) Sankey coexpression diagram. The left column represents autophagy-related genes, the middle column represents autophagy-related lncRNAs, and the right column represents risk types.
