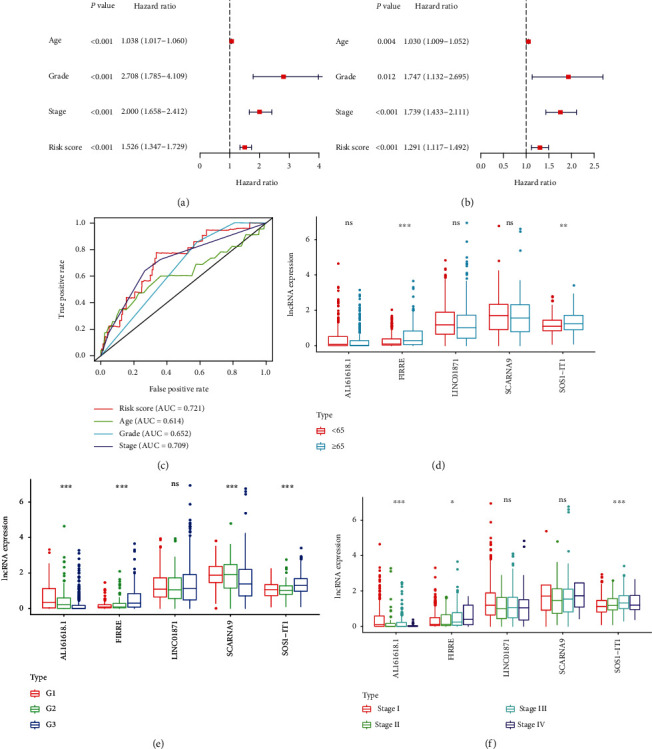
Figure 3.

Independent prognostic analysis and clinical correlation analysis. (a) A Forest plot of univariate independent prognostic analysis. The P value and hazard ratios and associated 95% confidence intervals are shown in the plot. Red indicates a risk-associated factor (HR > 1) and green indicates a protective factor (HR < 1). (b) A Forest plot of multivariate independent prognostic analysis. The P value and hazard ratios and associated 95% confidence intervals are shown in the plot. Red indicates a risk-associated factor (HR > 1) and green indicates a protective factor (HR < 1). (c) Multi-index ROC curve. Risk score AUC = 0.721; age AUC = 0.614; grade AUC = 0.652; stage AUC = 0.709. (d) lncRNA expression level in groups aged below 65 and above 65. Red indicates the group aged under 65 and blue indicates the group aged over 65. (e) lncRNA expression level in different pathologic grades. (f) lncRNA expression level in different FIGO stages. ∗P < 0.05; ∗∗P < 0.01; ∗∗∗P < 0.001. ns, P > 0.05.
