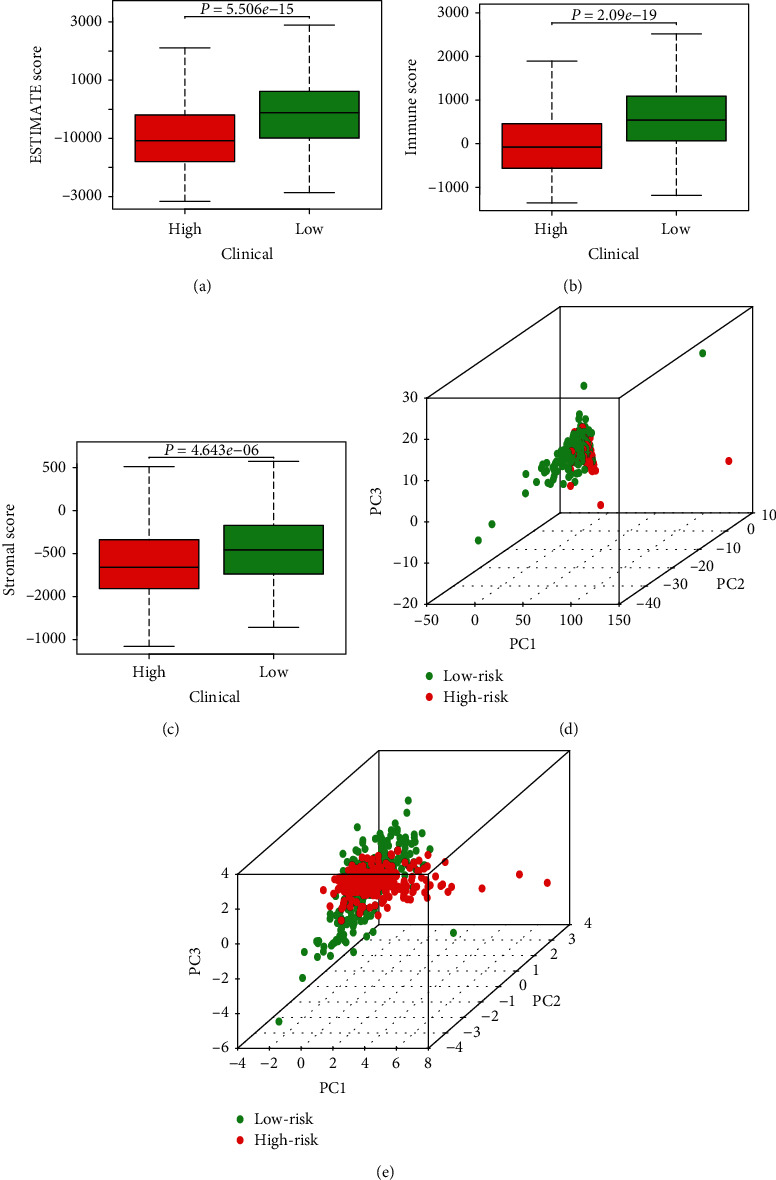
Figure 4.

Tumor microenvironment score and principal component analysis. (a) ESTIMATE scores for different risk statuses. The box-plot shows a significant difference between high- and low-risk groups (P < 0.05). (b) Immune scores for different risk statuses. The box-plot shows a significant difference between high- and low-risk groups (P < 0.05). (c) Stromal scores for different risk statuses. The box-plot shows a significant difference between high- and low-risk groups (P < 0.05). (d, e) Principal component analysis of low- and high-risk groups based on autophagy-related lncRNAs and risk-associated genes. Red indicates the high-risk group and green indicates the low-risk group.
