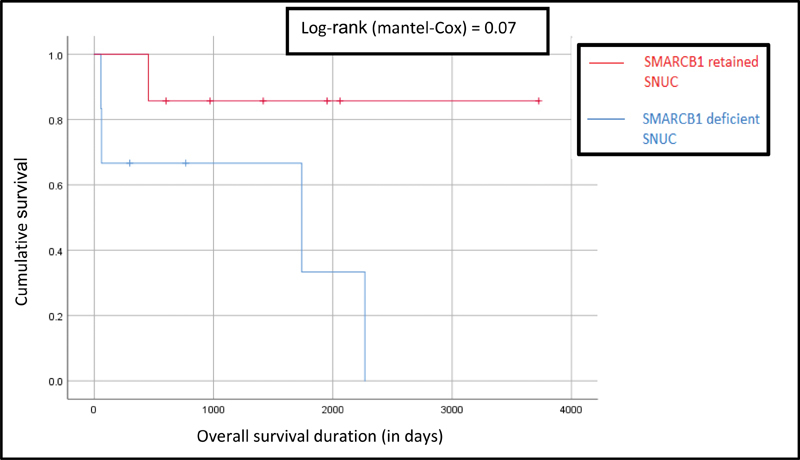
Fig. 3.

Comparison of Kaplan–Meier survival curves for overall survival between SR-SNUC and SD-SNUC. X axis denotes the duration of survival (in days) and Y axis denoted the cumulative survival. Vertical lines on each of the curves denote censored patients. SD-SNUC, SMARCB1 -deficient sinonasal undifferentiated carcinoma; SR-SNUC, SMARCB1 -retained SNUC.
