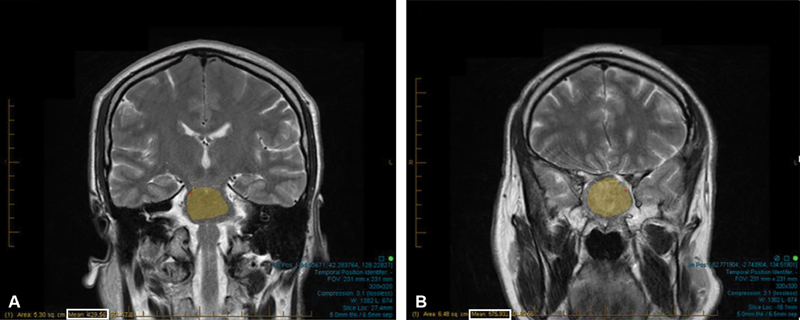
Fig. 1.

Free-hand selection tool used to select a region of interest (ROI). ( A ) ROI in pons on T2-coronal sequence. ( B ) ROI in PA on T2-coronal sequence. Maximum area was selected to ensure accurate intensity values (white box). Adenoma:pons calculation: ratio = mean intensity for ROI within PA (A; white box)/mean intensity value for ROI within pons (B; white box). Ratio = 429.56/575.93 = 0.7459.
