
Figure 2.
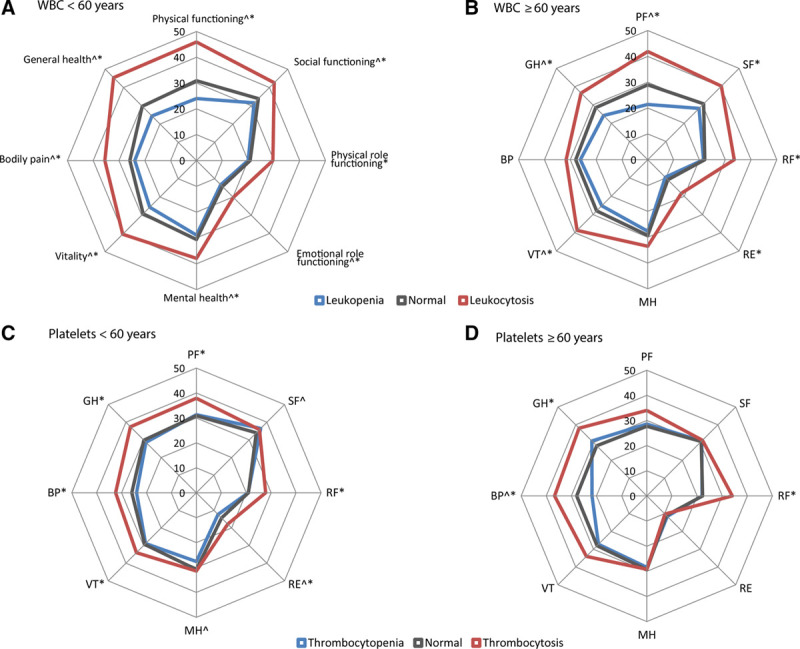
Percentage of individuals, stratified according to age group and blood cell count abnormality, with a score below the age- and sex-specific cut-off values for the different domains of the RAND-36 health survey. ^A significant difference in the proportion having a score below the age- and sex-specific cut-off value in individuals with leukopenia or thrombocytopenia as compared to individuals with a normal blood cell count. *A significant difference in the proportion having a score below the age- and sex-specific cut-off value in individuals with leukocytosis or thrombocytosis as compared to individuals with a normal blood cell count. WBC = white blood cell.