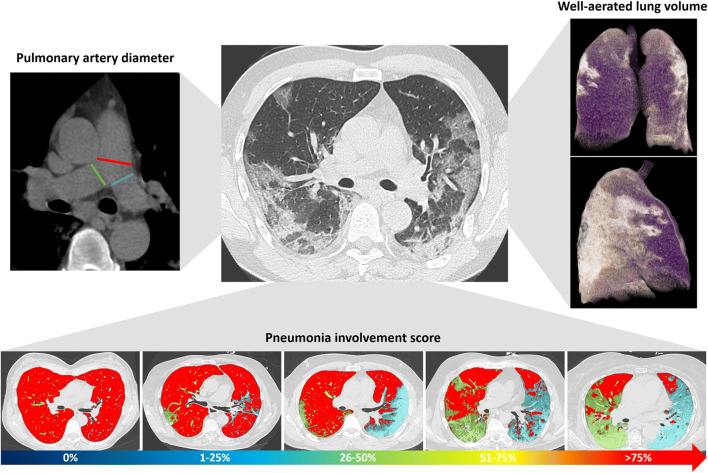
Fig. 2.
Imaging parameters extracted from chest CT in COVID-19 patients. For each patient, the diameter of the main pulmonary artery (red line) was measured at the level of its bifurcation and the diameter of right and left pulmonary arteries at the level of their origin (green and blue lines, respectively) on the mediastinal window reconstruction (top left of the panel). Using dedicated software, well-aerated lung volume was automatically extracted (violet parenchyma in 3D lung volume rendering on the top right of the panel). Pneumonia involvement was scored from 0 to 4 (score 0: 0%; score 1: 1–25%; score 2: 26–50%; score 3: 51–75% score 4: > 75%); well-aerated lung parenchyma is displayed in red, and pneumonia in green for the right lung and in blue for the left lung (bottom of the panel)

