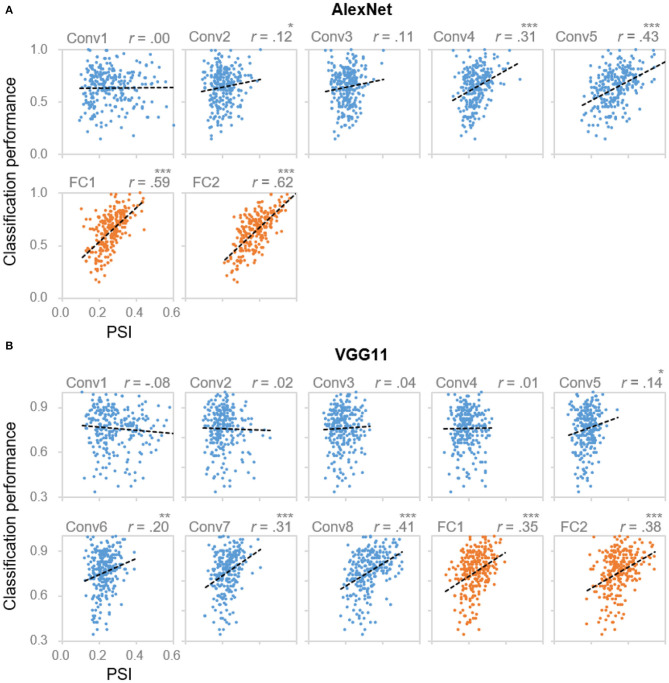
Figure 2.
Correlation between coding sparseness and behavioral performance. Layer-wise scatter plots of DCNNs' classification performance vs. PSI values from (A) AlexNet and (B) VGG11 for object categories from Caltech256. X axis: PSI value, the larger the value the sparser the coding; Y axis: DCNNs' classification performance for each object category. Each dot represents one category. *denotes p < 0.05, **denotes p < 0.01 and ***denotes p < 0.001. Categories with the best or the worst classification performances were listed in Supplementary Figure 4.

