
Figure 2.
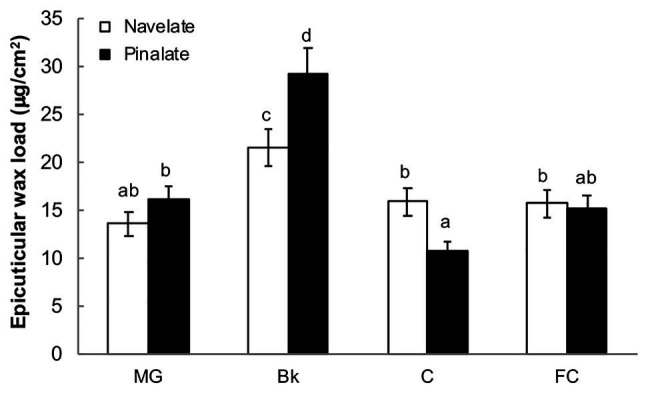
Evolution of epicuticular wax deposition during ripening. The total epicuticular wax load in the Navelate and Pinalate mature green (MG), breaker (Bk), colored (C), and full-colored (FC) fruit. Bars are the means ± SD of four replicates per condition. Different letters indicate the statistical (p < 0.05) differences between developmental stages and genotypes according to a multifactor ANOVA analysis followed by a Tukey test (p < 0.05).