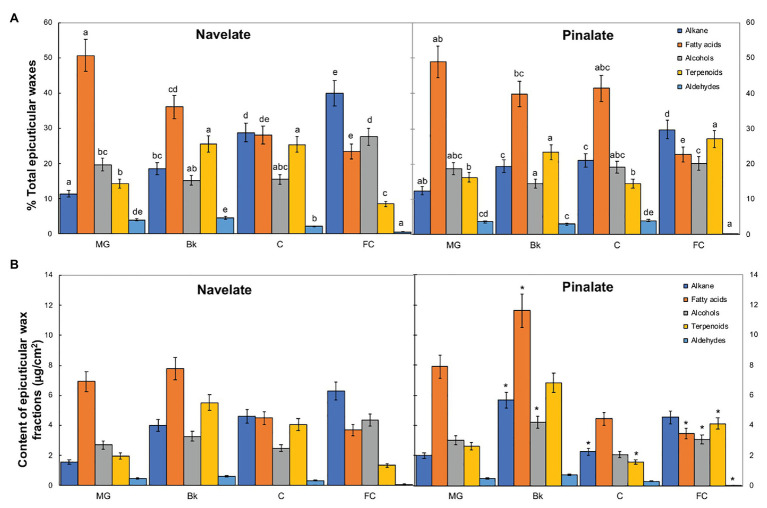
Figure 3.
Evolution of epicuticular wax composition during ripening. Percentage (A) and content (B) of the epicuticular wax fractions in the Navelate and Pinalate mature green (MG), breaker (Bk), colored (C), and full-colored (FC) fruits. Bars are the means ± SD of four replicates per condition. (A) Different letters indicate the statistical (p < 0.05) differences between developmental stages and genotypes according to a multifactor ANOVA analysis followed by a Tukey test (p < 0.05) for each wax fraction. (B) The asterisks on the Pinalate bars indicate the statistical (p < 0.05) differences between cultivars according to a t test for each developmental stage.

