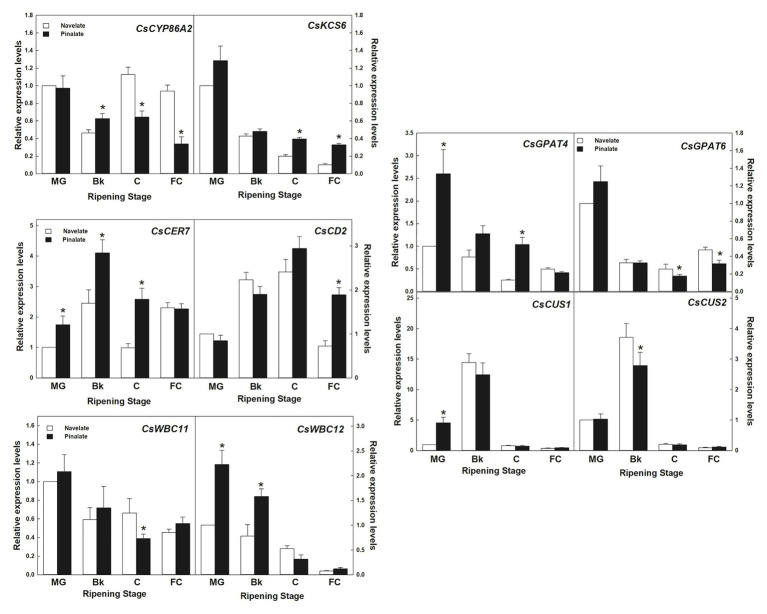
Figure 6.
Gene expression analysis of the cuticle-related genes selected from the RNA-Seq transcriptome comparative analysis. Relative transcript abundance for the selected wax and cutin biosynthetic genes, and the cuticle-related transcription factors and transporters belonging to the “lipid metabolism” category differentially regulated in the Navelate (black) and Pinalate (white) flavedo in four ripening stages. For each gene, the transcript levels for all conditions were expressed in relation to the MG Navelate fruit. Data are the mean values of three biological replicates ± SD. The asterisks on the Pinalate bars indicate the statistical differences between genotypes according to a t-test (p < 0.05) for each ripening stage. These values were also used for validating the transcriptomic data, with an R2 value of 0.934 in a linear regression analysis.

