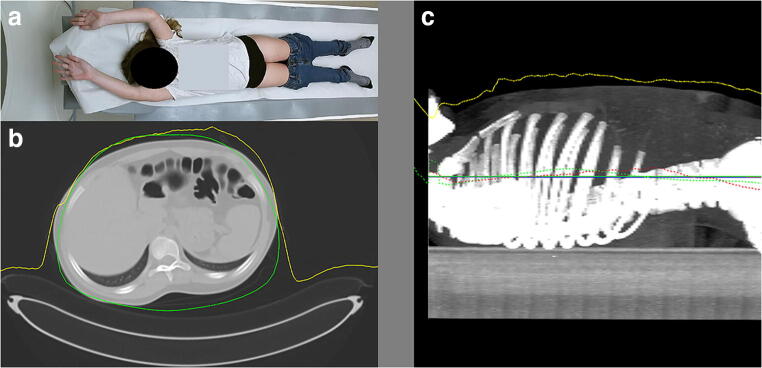
Fig. 4.
Case presentation of a 12-year-old child. a Color image taken by the 3D camera system. b Axial image of the abdomen with depth measurements (yellow line) by the 3D camera and the body contour (green) estimated by the algorithm. c Sagittal image of the thorax-upper abdomen with patient positioning accuracy: blue horizontal line: patient isocenter estimated by the radiographer, green horizontal line: average patient isocenter estimated by the camera, green dotted line: Avatar isocenter curve, red horizontal line: average patient isocenter (ideal table height), red dotted line: patient isocenter per axial cross-section, yellow line: depth measurements. The red, green, and blue straight lines are hard to distinguish from each other due to almost similar values as the ideal table height

