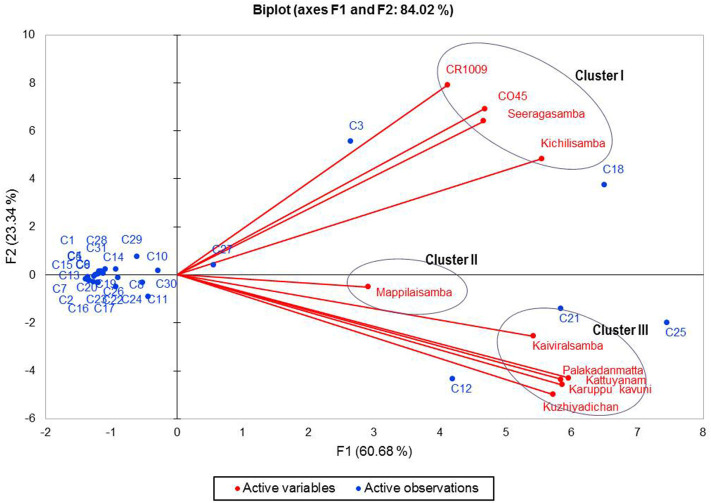
Figure 2.
Biplot principal component analysis (PCA) showing correlations of 10 rice samples. Axes (F1 and F2 factors, the first and second principal components, respectively) refer to the ordination scores obtained from the variables (samples) and observations (chemical compounds: C1–C31 from Table 1).

