FIGURE 5.
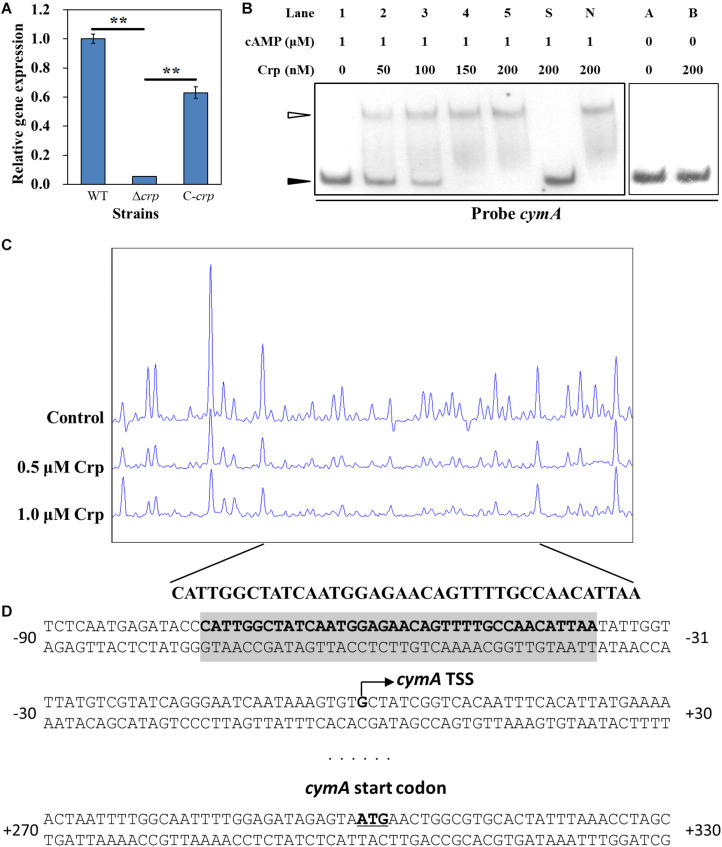
Regulatory effect of Crp on cymA gene. (A) The relative expression level of the cymA gene in the WT, Δcrp mutant, and C-crp mutant. cymA expression level in the WT strain was normalized as 1. Error bars indicate standard deviation of three samples. Significance analysis was performed using Student’s t-test; **p < 0.01. (B) EMSAs of the interaction of different concentrations of His6-Crp with DNA probes; 0.15 nM labeled probe and 1.0 μM cAMP were added to reaction mixtures with different concentrations of His6-Crp (Lanes 1, 2, 3, 4, and 5). A 300-fold-excess unlabeled specific competitor (Probe cymA, Lane S) and non-specific competitor (Lane N) were added to the mixture to perform specific or non-specific competition assays, respectively. Lanes A and B: Reaction mixtures without addition of cAMP used as negative controls. Filled triangles: Free probes. Empty triangle: Protein–DNA complex. (C) DNase I footprinting assay of different concentrations (0.5 and 1.0 μM) of His6-Crp and cymA in the upstream region. Each reaction mixture contains 300-ng FAM-labeled DNA probe and 2 μM cAMP. Control: No His6-Crp protein in the reaction mixture. The nucleotide sequences of the protected region were shown below the graph. (D) Nucleotide sequences of cymA promoter region and His6-Crp binding site. Bent arrow: Predicted cymA TSS. Shaded region: Region protected by Crp in the DNase I footprinting assay. Underline: cymA start codon. Numbers indicate the distance (nt) from TSS.

