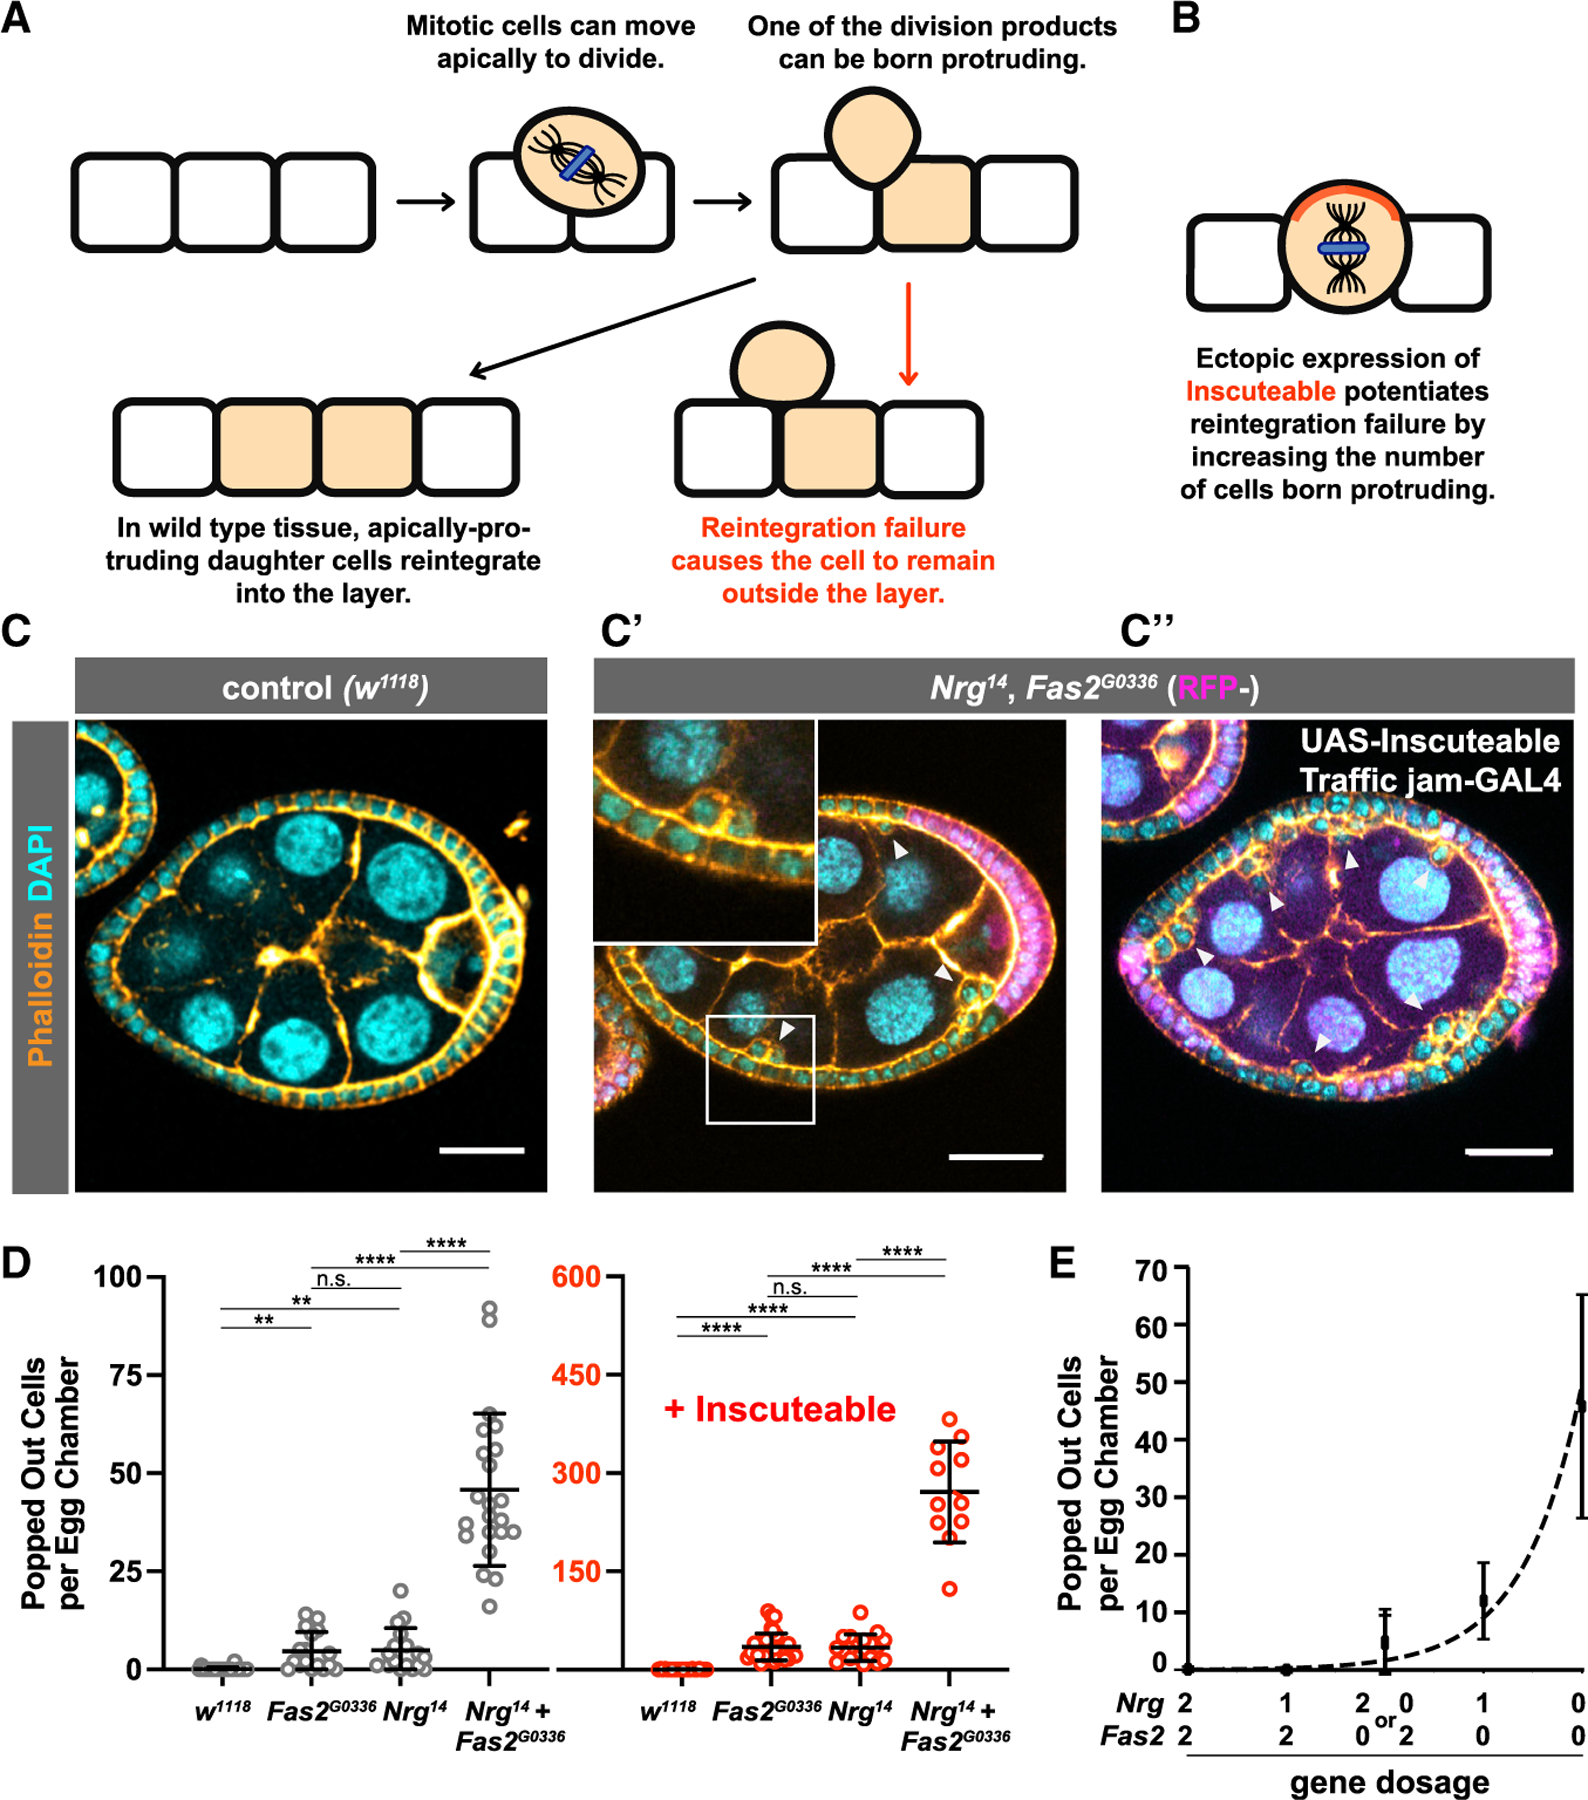
Figure 1. Nrg and Fas2 Act in Parallel to Drive Reintegration.

(A) Diagram showing apical cell movement during mitosis and subsequent cell reintegration.
(B) Inscuteable increases out-of-plane divisions and therefore the number of reintegration events.
(C and D) Genetic disruption of both Fas2 and Nrg causes a synergistic increase in reintegration failure over disruption of either gene alone. Ectopic expression of Inscuteable has a multiplicative effect on reintegration failure. Representative images are shown in (C) and quantification in (D). Each data point represents the number of extralayer (popped-out) cells in the entirety of one egg chamber. Each column represents three or more dissections of five or more flies. Significance was determined using an unpaired, two-tailed Student’s t test with Welch’s correction. p values left to right: p = 0.0018, p = 0.0031, p = 0.8723, p < 0.0001, p < 0.0001, p < 0.0001, p < 0.0001, p = 0.8201, p < 0.0001, p < 0.0001. Average and error bars correspond to mean and SD. Scale bars in (C) correspond to 20 µm.
(E) The relationship between reintegration failure and gene function is not linear. A plot of gene dosage versus misplaced cell number fits an exponential curve (R2 = 0.972), providing a speculative model for reintegration function. Average and error bars correspond to mean and SD.
