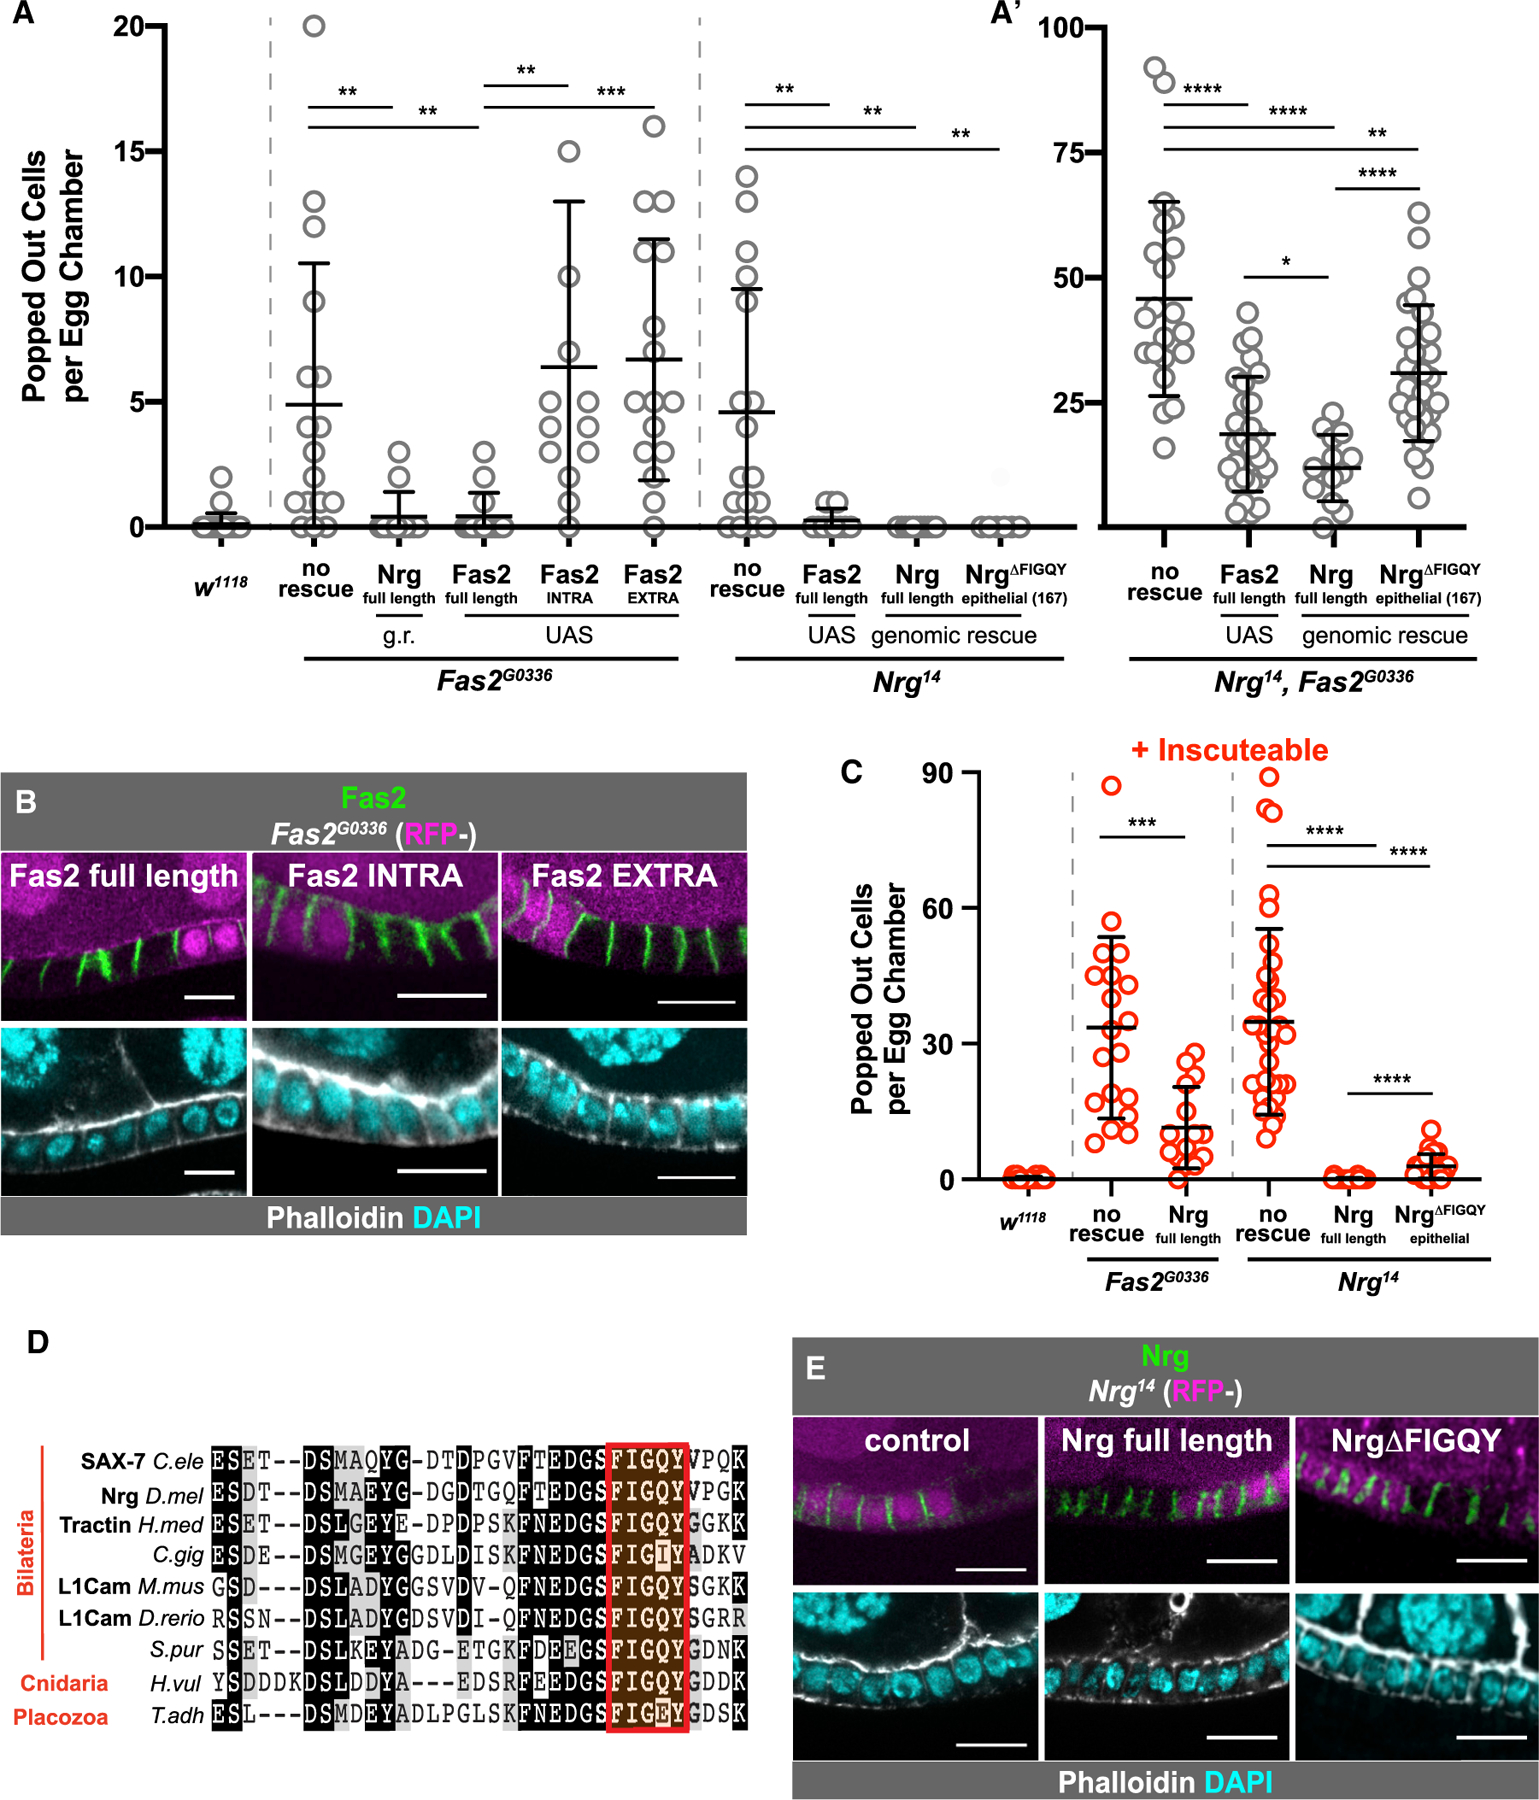
Figure 2. Dissection of Nrg and Fas2 Function.

(A) Genetic rescue experiments reveal the relative roles of Nrg and Fas2 in reintegration, through assessment of the “popping out” phenotype. Average and error bars correspond to mean and SD. Expression of full-length Fas2 rescues reintegration failure in Nrg- and Fas2-null tissue, but both the extracellular and intracellular domains are required to rescue Fas2G0336. Neuroglian rescues reintegration failure in Nrg- and Fas2-null tissue. Removal of the FIGQY subsequence from the epithelial Nrg isoform allows for partial rescue in Nrg-null tissue. p values left to right: p = 0.0052, p = 0.0052, p = 0.0071, p = 0.0001, p = 0.0023, p = 0.0014, p = 0.0014. (A’) Neither expression of full-length Fas2 or Nrg fully rescues reintegration failure caused by Nrg14,Fas2G0336 double mutants. The Nrg variant with a disruption in the epithelial FIGQY subsequence rescues reintegration failure significantly less than the full Nrg rescue. UAS-Fas2-YFP and variants were expressed using the driver Traffic Jam-GAL4. Neuroglian and Nrg variants were expressed from a single genomic rescue construct. p values left to right: p < 0.0001, p < 0.0001, p = 0.0044, p = 0.0221, p < 0.0001.
(B) Fas2 localizes to cell-cell borders without either its extracellular or intracellular domain. UAS-Fas2-YFP and its truncated variants, expressed using Traffic Jam-Gal4, could all be detected at follicle cell-cell borders, whether in the presence (RFP+) or absence (RFP−) of endogenous Fas2.
(C) Ectopic expression of Insc reveals that both Nrg overexpression in Fas2-null and expression of Nrg missing the FIGQY subsequence in Nrg-null tissues incompletely rescue the reintegration failure phenotype. Average and error bars correspond to mean and SD. p values left to right: p = 0.0002, p < 0.0001, p < 0.0001, p < 0.0001.
(D) The ankyrin-binding domain of Nrg/L1CAM is evolutionarily conserved.
(E) The FIGQY subsequence is not required for Nrg localization to epithelial cell-cell borders. Representative images are shown in (E) and quantified in Figure S2C. Quantification and statistical tests in (A) and (C) were performed as in Figure 1. Average and error bars in (A) and (C) correspond to mean and SD. Scale bars in (B) and (E) correspond to 5 µm. See also Figure S2.
