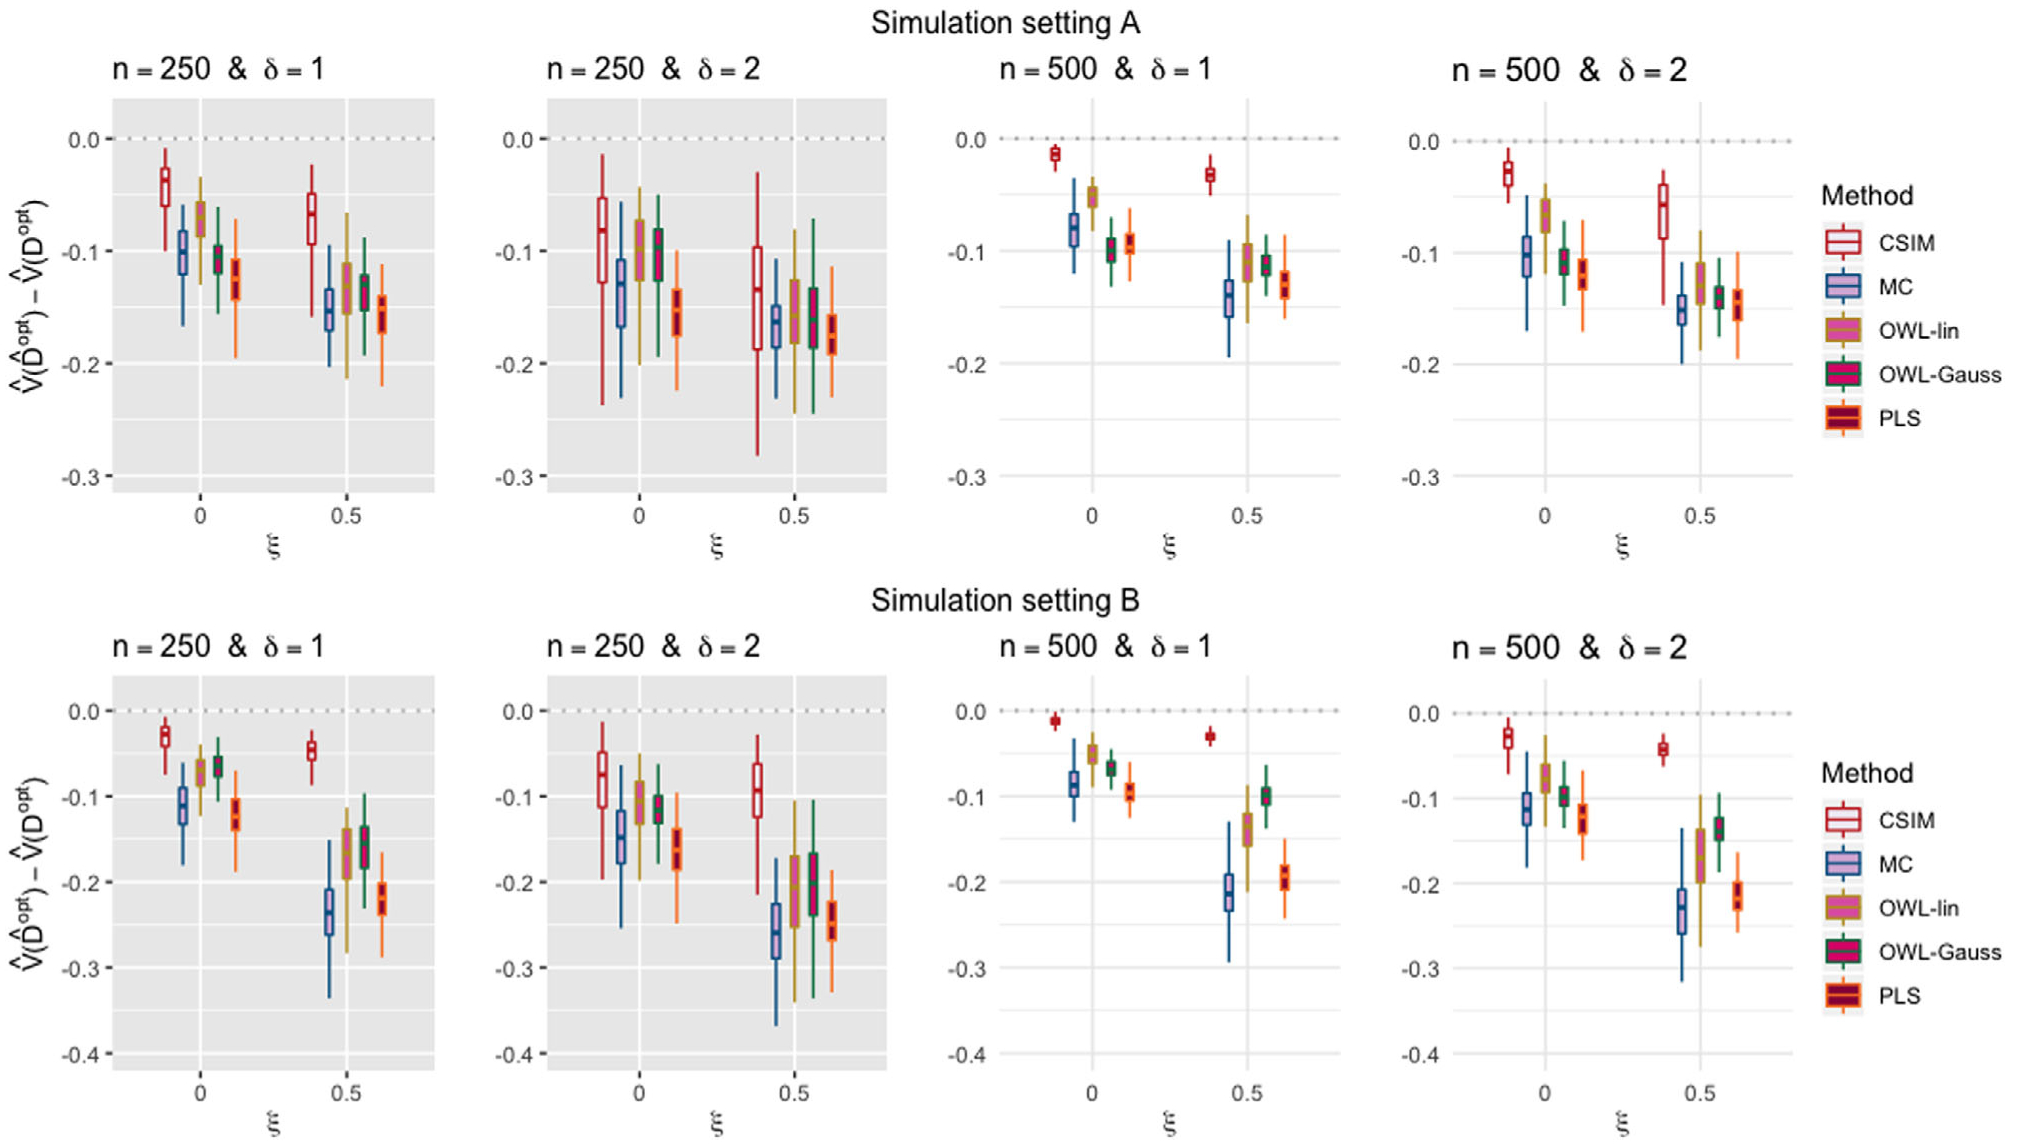
FIGURE 2.

Boxplots comparing five approaches to estimating , given each scenario indexed by ξ ∈ {0, 0.5} and δ ∈ {1, 2}, for the simulation setting “A” in the top panels and the setting “B” in the bottom panels. For each scenario, from left to right, estimation approaches for : (1) the constrained single-index model (red); (2) the modified covariates model (green); (3) the outcome weighted learning with a linear kernel (violet); (4) the outcome weighted learning with a Gaussian kernel (purple); (5) the penalized spline least squares approach (dark purple). The case with ξ = 0 (or ξ = 0.5) corresponds to the correctly specified (or misspecified) single-index interaction model scenario; δ = 1 (or δ = 2) corresponds to the moderate (or large) main effect scenario. The dotted horizontal line represents the optimal value corresponding to .
