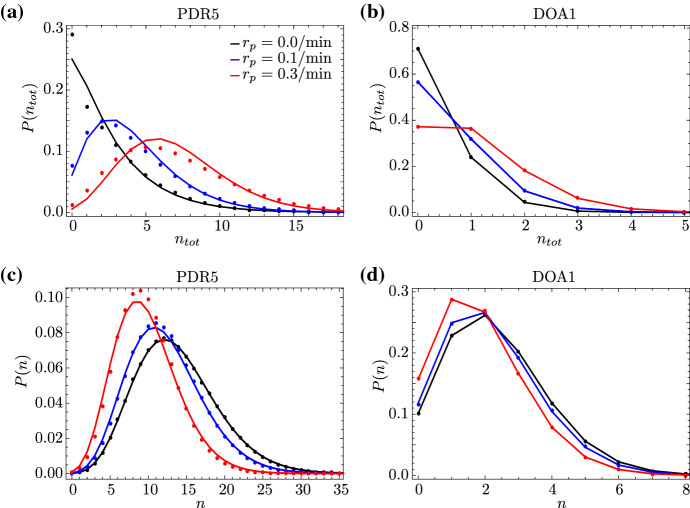
Fig. 10.
Dependence of the steady-state probability distributions of total RNAP and mature RNA on the RNAP pausing rate for two different genes in yeast. In a, b, we compare the distribution of the total number of RNAP molecules, as predicted by our model (solid lines), with that obtained from SSA (dots) for yeast genes PDR5 and DOA1, respectively. The model prediction involves fitting a Negative Binomial distribution with a mean and variance given by the closed-form expressions in Eqs. (41) and (42). In c, d, we compare the distribution P(n) of mature RNA, as obtained from singular perturbation theory (Eq. (43); solid lines) with the SSA (dots) for yeast genes PDR5 and DOA1, respectively. Note that for both genes, we keep all parameters fixed (including the elongation rate k) while varying the pausing rate to simulate an experiment where the pausing rate can be perturbed directly. The parameters for each gene can be found in Table 1a; we furthermore used and fixed k to , where is the mean elongation time measured experimentally and reported in Table 1a. Note that the actual mean elongation time is not fixed, as it depends on the pausing rate () via Eq. (40). The remaining parameters are fixed to /min, /min, and /min. The value of is taken from Table 1 in Rajala et al. (2010), where it is reported as the premature termination rate of polymerase in E. coli; the value of was chosen to be larger than that of to simulate a scenario where premature detachment is enhanced in the paused state. Note that our theory is less accurate for PDR5 than it is for DOA1, as all parameters are very small compared to the elongation rate in the latter case, hence satisfying better the assumptions behind the theory (Color figure online)

