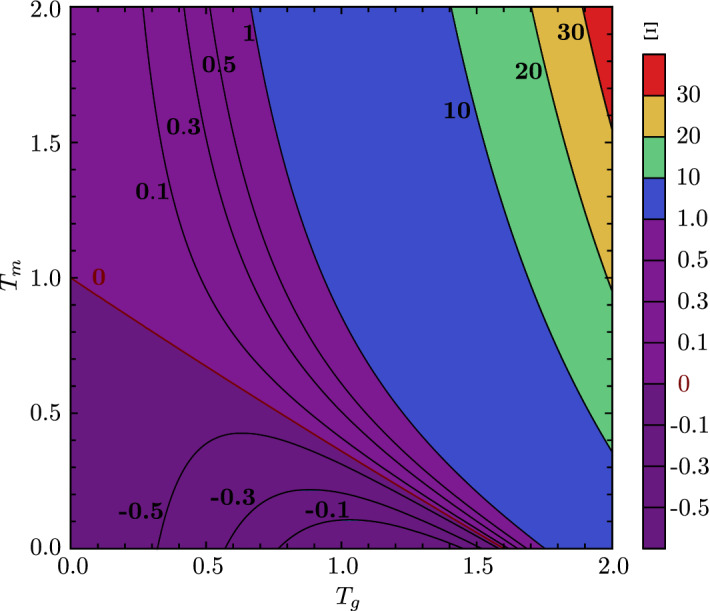
Fig. 5.

Comparison between the Fano factors of nascent and mature RNA. Contour plot showing the variation of —a measure of the difference between the two Fano factors which is defined in Eq. (18)—with the non-dimensional parameters and which denote the ratio of the mean elongation time to the timescales of promoter switching and decay of mature RNA, respectively. As can be appreciated from Eq. (17), is positive if the Fano factor of nascent RNA is larger than that of mature RNA and negative if the reverse is true. The line , where , shows where the two Fano factors are identical
