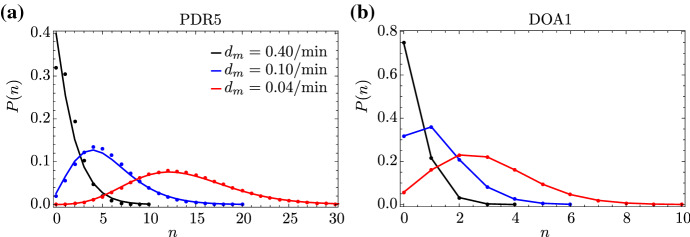
Fig. 7.
Steady-state distribution of mature RNA for two different genes in yeast. We compare the distribution obtained from SSA (dots) to the perturbative approximation in Eq. (33) (solid lines) for two different genes. In a, we consider the PDR5 gene, fixing the parameters as in Fig. 2: /min, /min, /min, /min, and min. The degradation rate of mature RNA takes the values /min; note that the experimental value is /min. In b, we consider the DOA1 gene, fixing the parameters as in Fig. 3: /min, /min, /min, /min, and min. The degradation rate of mature RNA again takes the values /min; the experimental value is /min. For both genes, the agreement between SSA and our perturbative approximation increases with , as expected, since Eq. (33) is derived under the assumption that . Note that the distribution is practically independent of L, since Eq. (33) depends on L only through , which for small premature detachment rates d implies for any L (Color figure online)

