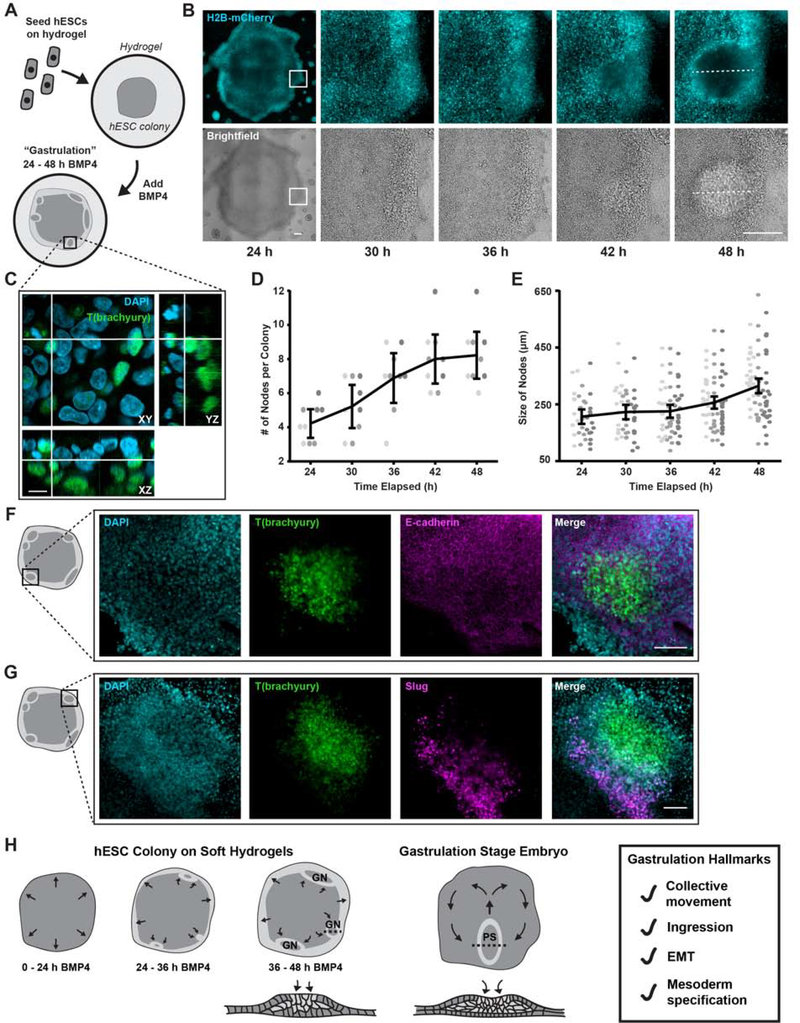
Figure 1: Compliant substrates promote hESC self-organization into “gastrulation-like” nodes.
(A) Cartoon of hESCs seeded on compliant (2,700 Pa) hydrogels and stimulated with BMP4.
(B) Representative time-lapse images of hESC colonies stimulated with BMP4. White rectangles indicate the region shown magnified in subsequent panels. Dashed lines indicate node size measurement, as plotted in (E). Scale bars = 250 μm.
(C) Representative Z-stack reconstruction of a “gastrulation-like” node after 48 h BMP4. Rectangle in (A) indicates imaged region. Scale bar = 10 μm.
(D) Plot of the number of nodes formed between 24 and 48 h BMP4. n = 9 (3, 3, 3) colonies.
(E) Plot of node size between 24 and 48 h BMP4. The dashed lines in (B) indicate node size measurement. Data points represent the size of each node identified from n = 9 colonies (3, 3, 3).
(F) Representative images of T(brachyury) expression, E-cadherin, and composite in the “gastrulation-like” nodes at 48 h BMP4. Rectangle on colony cartoon indicates imaged region. Scale bar = 100 μm.
(G) Representative images of T(brachyury) expression, Slug, and composite in the “gastrulation-like” nodes at 48 h BMP4. Rectangle on colony cartoon indicates imaged region. Scale bar = 100 μm.
(H) Schematic of the “gastrulation-like” phenotype observed in hESC colonies on compliant hydrogels, compared to gastrulation in the embryo. Cross-sections along dashed lines depicted below. GN = gastrulation node. PS = primitive streak. EMT = epithelial to mesenchymal transition.
For (D), (E): Data from independent experiments represented by different shades of gray and line and bars represent mean ± 95% CI.

