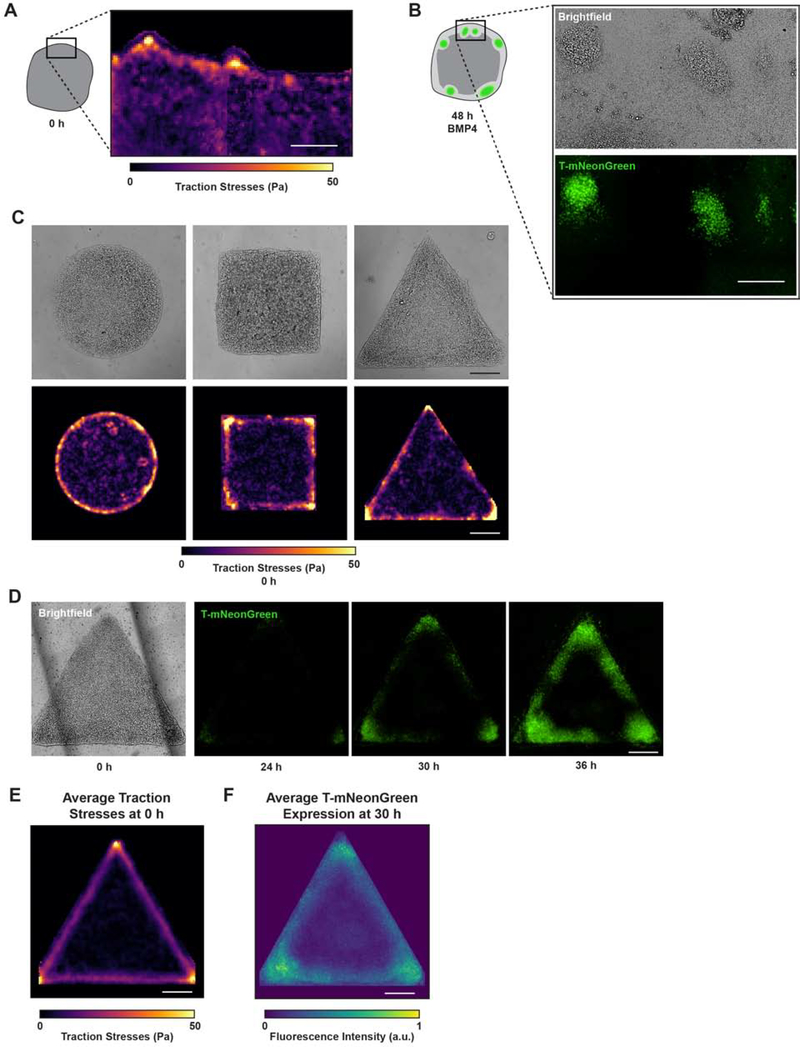
Figure 3: Cell-adhesion tension directs “gastrulation-like” node organization to specify mesoderm.
(A) Representative traction stress map of the periphery of unconfined hESC colonies prior to BMP4 stimulation. Rectangle on colony cartoon indicates measured region.
(B) Brightfield and T-mNeonGreen images 48 h after BMP4 in the same field of view where traction stresses were measured in (A).
(C) Representative brightfield images and corresponding traction stress maps measured for geometrically-confined hESC colonies on compliant gels before BMP4.
(D) Representative brightfield and time-lapse images of T-mNeonGreen expression for triangle hESC colonies on compliant gels following BMP4 addition.
(E) Map of average traction stresses measured for triangle hESC colonies before BMP4. n = 19 (3, 10, 6) colonies.
(F) Normalized average intensity map of T-mNeonGreen expression within triangle hESC colonies at 30 h BMP4. n = 12 (3, 1, 7, 1) colonies.
All scale bars = 250 μm. Pa = Pascals. a.u. = arbitrary units.
See also Figures S3–S4, Video S5.

