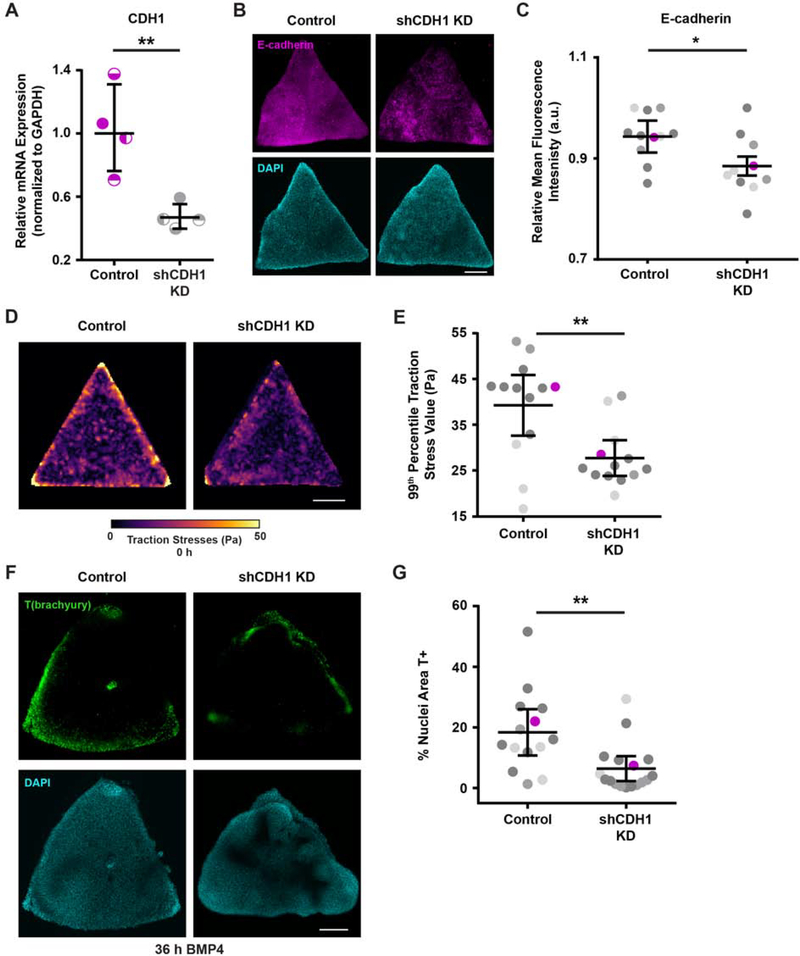
Figure 4: Cell-cell adhesion mediates the high tension required to develop “gastrulation-like” nodes.
(A) Relative CDH1 mRNA expression with and without shCDH1 knockdown.
(B) Representative images of E-cadherin expression with and without shCDH1 knockdown.
(C) Plot of relative E-cadherin mean fluorescence intensity with and without shCDH1 knockdown. Magenta data points correspond to the images shown in (B). n = 11 (2, 2, 7) control colonies and n = 10 (3, 2, 5) knockdown colonies.
(D) Representative traction stress maps for triangle hESC colonies with and without shCDH1 knockdown.
(E) Plot of the 99th percentile traction stress values from maps of triangle hESC colonies with and without shCDH1 knockdown. n = 13 (3, 2, 8) colony maps. Magenta data points correspond to representative maps in (D).
(F) Representative images of T(brachyury) expression at 36 h BMP4 in triangle colonies with and without shCDH1 knockdown.
(G) Plot of the % of nuclear area marked T-positive in triangle colonies with and without shCDH1 knockdown at 36 h BMP4. Magenta data points correspond to the images shown in (F). n = 14 (3, 3, 8) control colonies and n = 17 (2, 6, 9) knockdown colonies.
For (A), (C), (E), (G): Line and bars represent mean ± 95% CI. For (C), (E), (G): Data from independent experiments represented by different shades of gray. All scale bars = 250 μm. KD = knockdown. Pa = Pascals. a.u. = arbitrary units. *p < 0.05 and **p < 0.01.
See also Figure S5.

