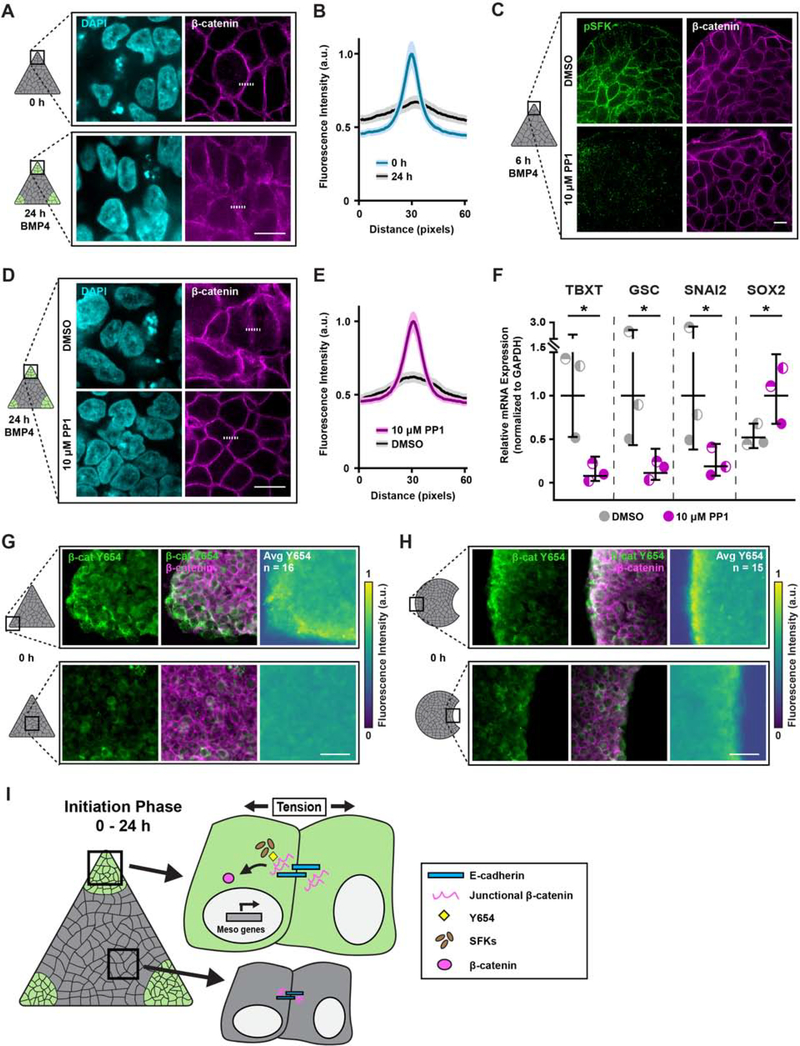
Figure 6: High tension promotes β-catenin release from adherens junctions to specify mesoderm.
(A) Representative images of β-catenin expression in the corners of triangle hESC colonies before and 24 h after BMP4.
(B) Plot of mean (solid line) ± 95% CI (shaded regions) fluorescence intensity of β-catenin at cell junctions in the corners of triangle hESC colonies before and 24 h after BMP4 stimulation. Dashed lines in (A) indicate plotted fluorescence intensity profiles. N = 130 profiles per condition from n = 26 (9, 8, 9) imaged colony corner ROIs.
(C) Representative images of phosphorylated Src-family kinase (pSFK) and β-catenin expression in the corners of triangle hESC colonies after 6 h BMP4 plus vehicle (DMSO) or Src inhibitor (PP1; 10 μM).
(D) Representative images of β-catenin expression in the corners of triangle hESC colonies after 24 h BMP4 plus vehicle (DMSO) or Src inhibitor (PP1; 10 μM).
(E) Plot of mean (solid line) ± 95% CI (shaded regions) fluorescence intensity of β-catenin at cell junctions in the corners of triangle hESC colonies after 24 h BMP4 plus vehicle (DMSO) or Src inhibitor (PP1; 10 μM). Dashed lines in (D) indicate plotted fluorescence intensity profiles. N = 130 profiles per condition from n = 26 (9, 8, 9) imaged colony corner ROIs.
(F) Relative mesoderm gene expression levels after 36 h BMP4 plus vehicle (DMSO) or Src inhibitor (PP1; 10 μM). Line and bars represent mean ± 95% CI.
(G) Representative images of β-catenin Y654 (green; left), composite β-catenin Y654 and normal β-catenin (merge; middle), and normalized average intensity map of β-catenin Y654 expression (right) within triangle hESC colonies prior to BMP4. n = 16 (3, 7, 6) colonies.
(H) Representative images of β-catenin Y654 (green; left), composite β-catenin Y654 and normal β-catenin (merge; middle), and normalized average intensity map of β-catenin Y654 expression (right) within Pac-Man hESC colonies prior to BMP4. n = 15 (5, 5, 5) colonies.
(I) Cartoon summarizing the mechanism by which regionally-localized high cell-adhesion tension exposes β-catenin Y654 to facilitate its phosphorylation and subsequent release, mediated by pSFKs, upon BMP4 stimulation.
For (A), (C), (D): Scale bars = 10 μm. For (G), (H): Scale bars = 50 μm. Rectangles on colony cartoons indicate imaged regions. β-cat Y654 = tyrosine 654 of β-catenin. pSFK = phosphorylated Src-family kinases. TBXT = T-Box Transcription Factor T. GSC = goosecoid. a.u. = arbitrary units. Avg = average. *p < 0.05.
See also Figure S6.

